Blog

  • The Perimeter Paradox: Anchoring Trust in the Modern Distributed Enterprise

    The Perimeter Paradox: Anchoring Trust in the Modern Distributed Enterprise

    Identity-first zero trust security the traditional network security model, centered on the “castle-and-moat” philosophy, has reached a point of systemic obsolescence. For decades, cybersecurity was synonymous with network hardening—assuming that anyone inside the corporate firewall was trustworthy and anyone outside was a threat. However, the mass migration to cloud-native architectures, the proliferation of unmanaged personal devices, and the normalization of remote work have dissolved the physical and digital boundaries that once defined the enterprise. When the workforce, the data, and the applications exist everywhere, the network itself becomes an unreliable metric for safety.

    In this boundaryless environment, the focus has shifted from protecting “where” someone is to verifying “who” someone is. This evolution marks the transition from network-centric defenses to a philosophy where the individual’s identity is the primary control plane. It is no longer sufficient to secure the pipe; one must secure the entity flowing through it. This shift is not merely a technical upgrade but a fundamental reimagining of the trust relationship between the user, their device, and the corporate resource.

    Implementing this philosophy requires moving beyond simple passwords or static multi-factor authentication. It demands a continuous, contextual interrogation of every request, regardless of its origin. As we navigate an era of increasingly sophisticated social engineering and credential-based attacks, the ability to establish a high-assurance, dynamic identity is the only viable path to long-term resilience. This article interrogates the structural mandates of this transition, moving beyond the industry buzzwords to examine the deep engineering and strategic rigor required to sustain a truly resilient, decentralized security posture.

    Understanding “Identity-First Zero Trust Security”
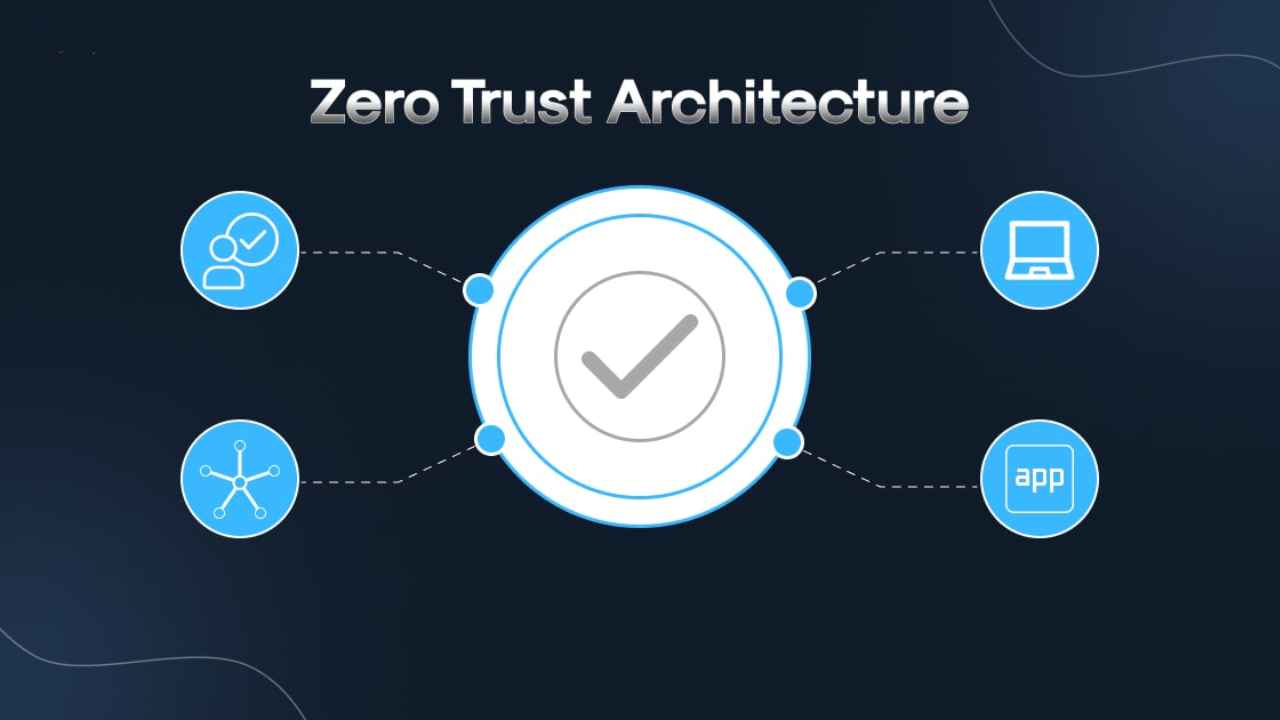
    To define Identity-First Zero Trust Security is to describe a system where the “Identity” of the requester serves as the foundational unit of all security decisions, preceding network connectivity or device health. A common misunderstanding in the IT sector is that Zero Trust is a product one can purchase; in reality, it is a strategic framework where “Assume Breach” and “Verify Explicitly” are the operating mandates. In an identity-first model, the enterprise treats identity as the new perimeter—a portable, cryptographic boundary that follows the user across different networks, locations, and cloud providers.

    Oversimplification in this domain often leads to “MFA Fatigue” or a false sense of security derived from basic Single Sign-On (SSO). True Identity-First Zero Trust Security incorporates “Contextual Signals”—such as geolocation, time-of-day, behavioral biometrics, and device security posture—to create a risk-weighted score for every access attempt. If a user typically accesses financial records from New York at 9:00 AM on a MacBook, a request from London at 3:00 AM on a Windows machine will trigger an immediate re-authentication or denial, even if the credentials are correct.

    From a multi-perspective view, the architecture must balance “Friction” with “Security.” For the developer, security must be invisible; for the security architect, it must be absolute. The risk of treating identity as a static attribute is that it ignores the “Temporal Nature of Trust.”

    Deep Contextual Background: The Erosion of Implicit Trust

    Identity-first zero trust security the journey toward identity-centric security began with the failure of the Virtual Private Network (VPN). This “Implicit Trust” became the primary vector for lateral movement during major data breaches in the early 2100s, as attackers realized that compromising a single set of credentials granted them the keys to the entire kingdom.

    The emergence of the Google-pioneered “BeyondCorp” model in the mid-2010s was the first major pivot away from the network. This was the nascent stage of the identity-first movement. Today, we have entered the “Maturity Phase,” where identity is no longer just about people; it includes “Non-Human Entities” (NHEs) such as service accounts, bots, and IoT devices, which often outnumber human users in modern cloud environments by a factor of 10 to 1.

    Conceptual Frameworks and Mental Models Identity-First Zero Trust Security

    The “Identity-as-the-Micro-Perimeter” Framework

    This model treats every individual application or data bucket as if it were a standalone castle. The “Moat” is no longer around the office building; it is around the specific piece of data. Identity is the only “Drawbridge.”

    The “Continuous Adaptive Risk and Trust Assessment” (CARTA)

    Proposed by industry analysts, this model suggests that security is a continuous loop. We start with “Initial Authentication,” move to “Continuous Monitoring,” then to “Behavioral Analysis,” and finally to “Response.” This model rejects the “Binary” view of security (Locked vs. Unlocked) in favor of a “Spectrum” of trust that fluctuates based on real-time data.

    The “Entitlement Graph” Model

    This mental model views the enterprise as a massive web of connections between users and resources. “Identity-First” means managing the “Edges” of this graph. Over time, “Entitlement Creep” occurs as users change roles but keep their old permissions.

    Key Categories and Variations

    Identity-centric architectures vary based on the “Class of Entity” being secured.

    Identity Category Primary Challenge Verification Mechanism Typical Trade-off
    Human Workforce Social engineering; MFA fatigue FIDO2/WebAuthn; Biometrics Security vs. User Experience
    Privileged Admins High-impact compromise Just-in-Time (JIT) Elevation Operational speed vs. Risk
    Service Accounts Credential leakage in code Secret Management; Workload Identity Integration complexity
    IoT/BMS Devices Weak hardware; no UI X.509 Certificates; MACsec Legacy compatibility
    B2B/Partner Cross-tenant visibility Identity Federation (SAML/OIDC) Control vs. Collaborative ease

    Realistic Decision Logic

    The decision to implement specific controls is governed by the “Value of the Resource.” A “Public-Facing Document” might only require a standard SSO check. However, a “Production Database” should require “Identity-First” protocols such as hardware-based keys and “Mutual TLS” (mTLS) where the machine must also prove its identity to the user.

    Detailed Real-World Scenarios Identity-First Zero Trust Security

    The “Session Hijack” in a Remote Environment

    • The Constraint: A marketing employee is working from a public café. Their session token is stolen via a sophisticated man-in-the-middle attack.

    • The Identification: The attacker attempts to use the stolen token from a different browser fingerprint.

    • The Identity-First Response: Because the system monitors “Context,” it notices the browser change and the sudden jump in “User-Agent” complexity. Instead of allowing the request, it invalidates the session and requires a fresh biometric re-authentication.

    • The Lesson: Credentials are not identity. Tokens are not identity. Contextual behavior is the only true validator.

     The “Over-Privileged Service Account”

    • The Constraint: A legacy script on a server has “Full Admin” rights to the cloud storage to perform backups.

    • The Failure: The server is compromised. The attacker uses the script’s hardcoded credentials to delete the backups.

    • The Identity-First Fix: Moving to “Workload Identity Federation.” The script no longer has a password; instead, it must request a temporary “Short-Lived Token” based on its unique machine signature.

    Planning, Cost, and Resource Dynamics

    The transition to an identity-first model is a capital-intensive shift in “Process” more than “Software.”

    Investment Category Estimated Cost Scope Variability Factor
    Identity Provider (IdP) Upgrade $5 – $20 per user/mo Advanced “Adaptive MFA” features
    IGA (Identity Governance) Tools $100k – $500k initial Complexity of existing “Legacy Debt”
    Professional Services/Audit $50k – $250k Number of integrated cloud applications
    Hardware Keys (YubiKeys) $25 – $75 per unit Distribution and “Lost-Key” replacement logistics

    Tools, Strategies, and Support Systems Identity-First Zero Trust Security

    1. Identity Governance and Administration (IGA): The “Control Center” for the user lifecycle—managing how identities are created, moved, and deleted.

    2. Passwordless Authentication: Utilizing the TPM (Trusted Platform Module) on modern laptops to replace passwords with cryptographic handshakes.

    3. Cloud Infrastructure Entitlement Management (CIEM): Identifying “Hidden Permissions” in cloud environments (e.g., a user who has permission to change their own permissions).

    4. Policy-as-Code (PaC): Writing access rules in a language like Rego (OPA) so they can be audited and version-controlled like software.

    5. User and Entity Behavior Analytics (UEBA): The “Brain” that learns what “Normal” looks like for every identity to flag anomalies.

    6. Customer Identity and Access Management (CIAM): Extending the same “Identity-First” rigor to external customers without ruining the “Sign-Up” conversion rate.

    Risk Landscape and Failure Modes

    Even an identity-first approach has “Structural Weak points.”

    • Identity Exhaustion: Forcing users to authenticate 50 times a day leads to “Approval Blindness,” where they click “Yes” on an MFA prompt just to make the notification go away.

    • Shadow Identity: Employees using personal accounts (e.g., using a personal Gmail to log into a corporate tool) creates a “Blind Spot” where the company has zero visibility into the access.

    Governance, Maintenance, and Long-Term Adaptation Identity-First Zero Trust Security

    Maintaining Identity-First Zero Trust Security requires a move away from “Annual Access Reviews” toward “Event-Driven Reviews.”

    The “Identity Hygiene” Checklist:

    • Orphaned Account Scan: Automated weekly checks for accounts belonging to employees who have left the company.

    • “Least Privilege” Drift Audit: Monthly reports showing users who haven’t used specific permissions in over 90 days.

    • MFA Bypass Monitoring: Alerting whenever a user logs in via a “Break-Glass” or legacy protocol that bypasses the Zero Trust stack.

    • Scenario Testing: Quarterly “Red Team” exercises specifically targeting the IdP and the PAM vault.

    Measurement, Tracking, and Evaluation

    • Leading Indicators: “Time to De-provision” (How long after a firing does access disappear?); “MFA Enrollment Percentage.”

    • Lagging Indicators: “Lateral Movement Success Rate” during security audits; “Mean Time to Detect” (MTTD) a credential-based attack.

    • Documentation Examples:

      1. The “Blast Radius” Report: A map showing exactly what an attacker could see if “User X” was compromised.

      2. The “Entitlement Lifecycle” Log: A full history of why every permission was granted and who approved it.

    Common Misconceptions and Oversimplifications Identity-First Zero Trust Security

    • Myth: “MFA means I am doing Zero Trust.” Correction: MFA is just a credential. Zero Trust is the “Continuous Verification” of the entire context of the request.

    • Myth: “Zero Trust is only for remote workers.” Correction: Most catastrophic breaches happen because internal networks are too “Soft.” Zero Trust is just as critical for people sitting in the office.

    • Myth: “Identity-First is too expensive for small firms.” Correction: The “Cost of a Breach” far outweighs the cost of modern cloud-based IdP tools, many of which have free tiers for small teams.

    • Myth: “It stops all attacks.” Correction: It stops lateral movement. An attacker can still compromise one user, but they will be “Trapped” in that user’s limited view of the world.

    Conclusion

    The transition to Identity-First Zero Trust Security represents the “Final Divorce” of security from physical geography. By placing the individual at the center of the architecture, organizations can finally embrace the agility of the modern digital economy without sacrificing the integrity of their most sensitive data. This is not a “Project” with an end date; it is a permanent state of “Dynamic Skepticism.” As the tools of the adversary continue to evolve, our definition of “Identity” must become more granular, more contextual, and more cryptographic. The perimeter hasn’t disappeared; it has simply moved to the person.


  • The Industrial Nervous System: Orchestrating Reliability Through Connected Intelligence

    The Industrial Nervous System: Orchestrating Reliability Through Connected Intelligence

    Predictive maintenance IoT networks the shift from reactive repair cycles to proactive machine health monitoring represents one of the most significant structural changes in industrial operations since the introduction of the assembly line. Historically, maintenance was a binary discipline: an asset was either functioning or it was broken. This “Run-to-Failure” model, while simple, carries an immense hidden tax in the form of unscheduled downtime, expedited parts shipping, and cascading secondary damage. The emergence of high-fidelity sensor arrays and ubiquitous connectivity has replaced this guesswork with a continuous stream of empirical data, transforming the factory floor into a quantifiable ecosystem.

    However, the transition to an instrumented environment is fraught with systemic complexity. It is not enough to simply “attach sensors” to a turbine or a conveyor belt. A truly resilient architecture requires a sophisticated integration of edge computing, low-latency communication protocols, and cloud-based analytical engines. We are seeing a move away from isolated data siloes toward unified networks that can contextualize a vibration spike in a motor against the ambient temperature of the facility and the current electrical load. This contextualization is the difference between a “False Positive” alarm and a critical intervention that saves a multi-million dollar asset.

    The challenge for modern industrial leadership is to view these installations not as an IT project, but as a fundamental shift in “Operational Philosophy.” To manage a network of connected sensors is to manage the “Risk Profile” of the organization’s physical capital. This requires a deep understanding of the “Physics of Failure”—the specific mechanical and electrical degradation paths that a sensor is meant to detect. This article provides a comprehensive interrogation of the technical and strategic layers required to build and sustain a high-performance monitoring environment, moving beyond the industry buzzwords to examine the structural mandates of long-term mechanical reliability.

    Understanding “Predictive Maintenance IoT Networks”

    To define Predictive Maintenance IoT Networks is to describe a multi-layered communication architecture designed to capture, transmit, and interpret “High-Entropy” industrial data. A frequent misunderstanding is the conflation of “Remote Monitoring” with “Predictive Analysis.” Remote monitoring tells you that a machine is hot; predictive analysis uses the historical trend of that heat, combined with vibration and acoustic signatures, to forecast exactly when a bearing will seize. The “Network” element is critical because it provides the “Backbone” that ensures data integrity and arrival time, both of which are paramount when dealing with high-speed machinery.

    The risk of oversimplification in this domain lies in ignoring the “Data Gravity” problem. In a large-scale facility, thousands of sensors generating data at kilohertz frequencies can easily overwhelm standard enterprise Wi-Fi. A sophisticated approach involves “Edge Intelligence,” where the sensor or a local gateway performs the initial Fourier Transform or anomaly detection, only sending “Alert-Relevant” packets to the cloud. This reduces the “Noise Floor” of the network and ensures that critical signals aren’t lost in a sea of baseline operational telemetry.

    From a strategic perspective, Predictive Maintenance IoT Networks must be viewed as “Feedback Loops.” The value is not in the data itself, but in the “Decision Support” it provides to the maintenance crew. If the network identifies a misalignment in a pump, but the workflow for issuing a work order is disconnected from the sensor dashboard, the system has failed. Integration with Enterprise Asset Management (EAM) and Computerized Maintenance Management Systems (CMMS) is what converts a technical signal into a business outcome.

    Deep Contextual Background: The Historical Evolution

    Predictive maintenance IoT networks the journey toward predictive intelligence began with “Preventive Maintenance”—the practice of replacing parts based on a calendar or a set number of “Run Hours.” While an improvement over waiting for a breakdown, preventive maintenance is inherently wasteful. It leads to the “Early Replacement” of perfectly functional components, introducing the “Infant Mortality” risk where a new part fails shortly after installation due to manufacturing defects or improper fitting.

    In the 1980s and 90s, “Condition-Based Maintenance” (CBM) introduced portable diagnostic tools. Technicians would walk the floor with handheld vibration pens or infrared cameras once a month. This “Snapshot” approach was better but suffered from “Intermittent Blindness.” If a fault developed on the second day of the month, it might go undetected until the next scheduled walk-through.

    The current era, defined by Predictive Maintenance IoT Networks, solves the “Blindness” problem through “Continuous Vigilance.” The plummeting cost of MEMS (Micro-Electro-Mechanical Systems) sensors and the rise of “Low-Power Wide-Area Networks” (LPWAN) like LoRaWAN have made it economically viable to monitor even “Tier 2” and “Tier 3” assets that were previously ignored. We have moved from a “Scheduled Inspection” culture to an “Exception-Based” culture, where the machines effectively “call for help” only when they need it.

    Conceptual Frameworks and Mental Models Predictive Maintenance IoT Networks

    The “P-F Interval” Logic

    This framework focuses on the time between a “Potential Failure” (P)—the point where a fault is first detectable—and the “Functional Failure” (F)—the point where the machine stops working. A robust IoT network aims to push the “P” detection as far back as possible using “Deep Feature Extraction” in the data, giving the maintenance team weeks or months of “Lead Time” rather than hours.

    The “Asset Hierarchy” Framework

    Not all machines are created equal. This model categorizes assets into “Critical,” “Essential,” and “Support.” Stabilization and monitoring resources are allocated based on the “Cost of Failure.” A critical turbine gets high-frequency, tri-axial vibration sensing with redundant power; a cooling fan might only get a simple temperature and current-draw sensor.

    The “Digital Twin” Convergence

    This mental model treats the IoT network as the “Sensory Input” for a mathematical model of the machine. By comparing the real-time sensor data against the “Ideal Physics” of the digital twin, the system can identify “Subtle Deviations” that wouldn’t trigger a standard threshold alarm but indicate a long-term efficiency decay.

    Key Categories and Variations Predictive Maintenance IoT Networks

    IoT architectures for maintenance vary significantly based on the “Physical Environment” of the facility.

    Network Type Connectivity Protocol Range/Throughput Primary Benefit
    Star Topology (LoRaWAN) Long-range Radio 5-15km / Low Pierces concrete and steel; long battery life
    Mesh Networking (Zigbee) Short-range Radio 10-100m / Moderate Self-healing; high density in small areas
    Cellular (5G/NB-IoT) LTE/5G Global / High No local gateway required; massive bandwidth
    Wired (Ethernet/IO-Link) Copper/Fiber Unlimited / Ultra-High Absolute reliability; power-over-ethernet (PoE)

    Realistic Decision Logic

    The “Physics of the Floor” dictates the tech stack. In a subterranean mine or a high-interference shipyard, a wired or LoRaWAN system is often the only choice. In a modern “Light Industrial” assembly plant, 5G or Wi-Fi 6 might provide the flexibility needed for reconfigurable production lines. The decision must be: “Can this protocol maintain signal integrity under the highest electromagnetic interference (EMI) our equipment generates?”

    Detailed Real-World Scenarios Predictive Maintenance IoT Networks

    The “Resonance” Detection

    • The Constraint: A high-speed paper mill where even a 5-minute stop ruins thousands of feet of product.

    • The Event: A tri-axial vibration sensor detects a “Spectral Peak” that doesn’t match standard bearing wear.

    • The Analysis: The network correlates the vibration with a change in the mill’s speed, identifying a “Structural Resonance” that would have cracked the machine frame within 48 hours.

    • The Fix: The system automatically limits the mill’s speed to a “Safe Zone” until a reinforcement bracket can be installed during a scheduled weekend stop.

     The “Silent Leak”

    • The Constraint: A distributed compressed air system in an automotive plant.

    • Failure: Traditional pressure gauges show no issue, but the “Acoustic IoT” sensors detect high-frequency ultrasonic “hissing.”

    • Outcome: The network identifies 15 minor leaks that were collectively causing a 20% “Efficiency Tax” on the compressors.

    • Second-Order Effect: By fixing the leaks, the plant avoids the “CapEx” of buying an additional compressor to handle the perceived load.

    Planning, Cost, and Resource Dynamics

    The “Total Cost of Ownership” (TCO) for a maintenance network is often 3x the initial hardware price when factoring in installation and data management.

    Cost Element Estimated Range (per Node) Variability Factor
    Industrial Sensor Hardware $200 – $1,200 IP-Rating (Waterproofing); sampling rate
    Gateway Infrastructure $1,500 – $5,000 Number of concurrent connections; backhaul type
    Cloud/AI Subscription $5 – $50 / month Complexity of the “Prediction Engine”
    Installation & Commissioning $300 – $2,000 Wiring requirements; hazardous environment access

    Tools, Strategies, and Support Systems

    1. Automated Feature Engineering: Tools that automatically identify which sensor frequencies correlate most strongly with failure.

    2. Edge Gateways: Local hardware that performs “Data Thinning” to save on cellular bandwidth and cloud storage costs.

    3. Digital Thermography: Using IoT-enabled IR cameras to monitor electrical panels for “Hot Spots” caused by loose connections.

    4. Oil Quality Sensors: Real-time analysis of “Ferrous Content” and acidity in lubrication systems, replacing quarterly manual samples.

    5. Smart Ultrasonic Sensors: Detecting “Arcing” in high-voltage transformers before they explode.

    6. Current Signature Analysis (MCSA): Using the electrical “Noise” of a motor to diagnose mechanical issues in the driven load.

    7. Dynamic Thresholding: Algorithms that adjust “Warning” levels based on the current load and age of the machine.

    Risk Landscape and Failure Modes Predictive Maintenance IoT Networks

    A network designed to prevent failure can, itself, be a point of failure.

    • The “False Sense of Security” Trap: If the sensors are not calibrated or if the “Batteries” die without a notification, the maintenance team stops doing visual inspections, assuming the system will catch everything. This leads to “Catastrophic Surprise.”

    • The “Cyber-Physical” Threat: If an attacker gains access to the IoT network, they can “Mask” a real failure or trigger “Emergency Shutdowns” to cause economic damage.

    • “Alarm Fatigue”: A poorly tuned network that sends 50 “Minor Anomaly” emails a day will eventually be ignored by the human crew. A critical alert will then be missed.

    Governance, Maintenance, and Long-Term Adaptation

    A Predictive Maintenance IoT Networks installation is a “Living System” that requires its own maintenance schedule.

    The “System Integrity” Checklist:

    • Sensor Calibration Audit: Yearly verification that a “10mm/s” vibration reading is actually 10mm/s.

    • Network Latency Test: Ensuring that “Critical Over-Temperature” alerts aren’t getting stuck in a gateway buffer.

    • Battery Replacement Cycle: For wireless nodes, a proactive 2-year or 5-year replacement plan based on actual discharge curves.

    • Model Retraining: As a machine is repaired or overhauled, its “Baseline” changes. The AI must be “Reset” to learn the new “Healthy State.”

    Measurement, Tracking, and Evaluation Predictive Maintenance IoT Networks

    • Leading Indicators: “Mean Time to Detect” (MTTD); “Prediction Accuracy” (Percentage of alerted faults that were real).

    • Lagging Indicators: “Reduction in Unscheduled Downtime”; “Overall Equipment Effectiveness” (OEE).

    • Documentation Examples:

      1. The “Failure Fingerprint” Library: A historical record of the specific sensor patterns that preceded past breakdowns.

      2. The “Cost Avoidance” Log: A report showing the estimated repair cost of a breakdown vs. the actual cost of the predictive intervention.

    Common Misconceptions and Oversimplifications

    • Myth: “AI can predict any failure.” Correction: AI can only predict failures that have “Detectable Precursors.” A sudden “Snap” of a bolt due to an over-torque event is often invisible to sensors until it happens.

    • Myth: “More data is always better.” Correction: High-frequency raw data is expensive to store and process. “Smart Data”—summarized at the edge—is far more valuable.

    • Myth: “IoT replaces the maintenance technician.” Correction: IoT empowers the technician. It tells them where to go and what tools to bring, but the physical repair still requires human judgment.

    • Myth: “Wireless is unreliable in factories.” Correction: With modern “Frequency Hopping” and “Mesh Protocols,” wireless can exceed 99.9% reliability in even the most challenging metal-heavy environments.

    Ethical and Practical Considerations Predictive Maintenance IoT Networks

    The deployment of pervasive sensing raises questions about “Workplace Monitoring.” While the intent is to monitor the machine, the data inevitably reveals the “Work Patterns” of the operators. This requires a clear governance policy: the data should be used to improve “Machine Performance,” not to penalize an operator for taking a longer break. Transparency in “Data Intent” is critical for maintaining the “Social Contract” on the shop floor.

    Conclusion

    The architecture of Predictive Maintenance IoT Networks represents the “Final Maturation” of industrial automation. By closing the gap between physical reality and digital awareness, organizations can finally escape the “Cycle of Crisis” that has characterized maintenance for a century. This transition is not instantaneous; it requires a patient, layered approach to data integrity, network resilience, and cultural adaptation. However, the result—a facility that is self-aware, predictable, and fundamentally more efficient—is the prerequisite for any enterprise seeking to lead in a hyper-competitive, resource-constrained global economy.

  • The Sovereign Circuit: Orchestrating Equilibrium in Decentralized Power

    The Sovereign Circuit: Orchestrating Equilibrium in Decentralized Power

    On-site microgrid stabilization the transition from a centralized “Hub-and-Spoke” utility model to a distributed energy landscape has introduced a profound technical paradox: while localized generation increases resilience, it simultaneously degrades the inherent stability provided by the massive inertia of the national grid. Traditional power systems rely on the sheer rotational momentum of giant turbines to “ride through” minor disturbances. In contrast, a microgrid—comprising solar photovoltaics, wind turbines, and battery storage—is an inverter-based ecosystem that lacks this mechanical cushion. Achieving equilibrium in such an environment requires a sophisticated layer of digital and electrical orchestration.

    The volatility of renewable sources, coupled with the “Step-Load” demands of modern industrial equipment, creates a high-stakes environment where voltage and frequency can fluctuate violently within milliseconds. Without a rigorous strategy for stabilization, a microgrid risks “Nuisance Tripping,” equipment damage, or total system collapse during the critical transition from grid-connected to “Islanded” mode. The challenge is not merely to generate power, but to maintain the “Power Quality” necessary for sensitive digital infrastructure and precision manufacturing.

    True energy independence is therefore not a matter of hardware accumulation, but of control logic. To manage an on-site energy system is to engage in a continuous, high-speed negotiation between supply, demand, and storage. This article interrogates the structural and algorithmic requirements of localized grid management, moving beyond the surface-level discussion of “Backup Power” to examine the deep engineering required for a self-sustaining, balanced electrical sovereign.

    Understanding “On-Site Microgrid Stabilization”

    To define On-Site Microgrid Stabilization is to describe the active management of frequency and voltage within a localized power system to ensure it remains within operational tolerances. A common misunderstanding among facility managers is the belief that a Battery Energy Storage System (BESS) acts as a universal stabilizer by default. In reality, a BESS is only as effective as its “Inverter Control Strategy.” If the inverter is “Grid-Following,” it will shut down the moment the main utility fails; if it is “Grid-Forming,” it must assume the gargantuan task of establishing the voltage and frequency for the entire site.

    Oversimplification in this domain often ignores the “Transient Stability” window. When a large motor starts up, it draws a massive “Inrush Current” that can momentarily sag the voltage of a small microgrid. If the stabilization system cannot respond within cycles—not seconds—the resulting voltage dip can trigger the protective relays of other equipment, causing a “Cascading Failure” across the facility. Understanding On-Site Microgrid Stabilization requires shifting the focus from “Average Power” to “Peak Instantaneous Demand.”

    From a multi-perspective view, stabilization is a three-layer problem: the “Primary” layer (millisecond-scale local response), the “Secondary” layer (second-to-minute scale balance of generation and load), and the “Tertiary” layer (long-term economic and state-of-charge optimization). A failure in any layer eventually migrates to the others. The risk of treating this as a simple “battery problem” is that it ignores the role of “Synchronous Condensers” or “Load Shedding” protocols which are often more cost-effective than simply oversizing a battery array to handle rare peak surges.

    Deep Contextual Background: The Erosion of Grid Inertia

    On-site microgrid stabilization the historical stability of the American electrical grid was a byproduct of “Mechanical Inertia.” Large coal, gas, and nuclear plants used massive spinning rotors that, due to the laws of physics, resisted changes in frequency. If a small factory started a large motor, the rotational energy of turbines hundreds of miles away would provide the “Instantaneous Reserve” to keep the frequency stable. This was a “Passive” stabilization system inherent to the technology of the 20th century.

    As we decouple from fossil fuels, we are replacing these spinning masses with “Inverter-Based Resources” (IBRs). Solar panels and batteries produce Direct Current (DC), which is converted to Alternating Current (AC) via power electronics. These systems have zero physical inertia. Consequently, when a microgrid is islanded, the “Rate of Change of Frequency” (RoCoF) can be incredibly high. A minor imbalance that would be a non-event on the main grid becomes an existential threat to an on-site system. This systemic shift has necessitated the development of “Virtual Inertia”—using software to mimic the behavior of a spinning turbine by forcing inverters to respond rapidly to frequency deviations.

    Conceptual Frameworks and Mental Models On-Site Microgrid Stabilization

    The “Balancing Bucket” Analogy

    Imagine the microgrid as a bucket of water where the water level represents the frequency. Inflows (Generation) must exactly match outflows (Load). In a small bucket (Microgrid), a small splash causes a massive wave, whereas in a lake (Main Grid), the same splash is invisible. Stabilization is the art of using a “Fast-Acting Valve” (BESS) to counteract these splashes before the water spills over.

    The “N-1” Contingency Model

    This framework posits that a microgrid is only stable if it can survive the sudden loss of its largest single generation source or the sudden application of its largest single load without collapsing. This forces planners to design “Operating Reserves”—excess capacity that is kept spinning or “hot” specifically for stabilization rather than for serving the primary load.

    The “Three-Pillar” Stability Matrix

    This model separates stabilization into three distinct technical disciplines:

    1. Voltage Stability: Maintaining the electrical pressure.

    2. Frequency Stability: Maintaining the 60Hz timing of the AC wave.

    3. Rotor Angle/Phase Stability: Ensuring all generation sources are perfectly “In-Sync.”

    Key Categories of Stabilization Architectures

    Architecture Type Stabilization Mechanism Primary Trade-off Application
    Grid-Forming BESS Software-defined Virtual Inertia High inverter cost; complex logic Mission-critical datacenters
    Synchronous Condenser Physical spinning mass (no fuel) Mechanical wear and maintenance Heavy industrial/Motor-heavy sites
    Active Load Management High-speed automated load shedding Requires “Interruptible” processes Facilities with non-critical loads
    Hybrid Kinetic-Chemical Flywheels + Lithium-ion High footprint; highest speed High-tech manufacturing labs

    Realistic Decision Logic

    The choice of architecture is governed by the “Tolerance for Deviation.” A commercial office building can tolerate a 5% voltage sag for 100 milliseconds; a semiconductor fabrication plant cannot. Therefore, the “Precision Demand” of the site’s equipment dictates whether a project invests in expensive Flywheel/UPS combinations or relies on slower, software-based BESS management.

    Detailed Real-World Scenarios On-Site Microgrid Stabilization

    The “Cloud-Transient” Surge

    • The Constraint: A 5MW solar-heavy microgrid operating in islanded mode on a partly cloudy day.

    • The Event: A cloud bank moves over the array, dropping generation by 80% in 10 seconds.

    • The Decision Point: The Microgrid Controller must decide whether to dump the battery or shed “Tier 3” loads (e.g., HVAC) immediately.

    • Failure Mode: If the BESS “Ramp Rate” is too slow, the frequency drops below 58Hz, triggering the main breakers and blacking out the site.

    • Resolution: Implementing “Solar Forecasting” data into the controller to pre-position the BESS charge level before the cloud arrives.

     The “Motor Inrush” Sag

    • The Constraint: An on-site microgrid supporting a food processing plant.

    • The Event: A 500HP compressor kicks on.

    • Second-Order Effect: The voltage sags, causing the contactors on the conveyor belts to chatter and fail.

    • The Fix: Integrating “Variable Frequency Drives” (VFDs) on all large motors to “Soft Start” them, reducing the instantaneous demand and lessening the burden on the stabilization system.

    Planning, Cost, and Resource Dynamics

    Stabilization is an “Insurance Expense”—you are paying for the capability to handle the “1% Event.”

    Component Cost (USD) Variability Factor
    Microgrid Controller (Master) $50,000 – $250,000 Number of integrated I/O points
    Grid-Forming Inverter Premium 20% – 35% extra “Black Start” and Virtual Inertia specs
    Synchronous Condenser $200k – $1M+ Scaled by MVAR (Reactive Power) needs
    Fiber-Optic Relay Network $10 – $25 per ft Speed of “Peer-to-Peer” communication

    Tools, Strategies, and Support Systems On-Site Microgrid Stabilization

    1. Hardware-in-the-Loop (HIL) Simulation: Testing the control logic against a digital twin of the microgrid before deployment.

    2. Phasor Measurement Units (PMUs): High-speed sensors that measure the “State” of the grid 60 times per second to detect oscillations early.

    3. Adaptive Protection Relays: Relays that change their trip settings depending on whether the system is “Grid-Tied” (high fault current) or “Islanded” (low fault current).

    4. Static VAR Compensators (SVC): Used to provide near-instantaneous reactive power for voltage support.

    5. Direct Load Control (DLC): Bypassing local thermostats to shed load directly from the master controller during a stability event.

    6. Hydrogen Peaking Plants: For ultra-long-term stabilization where batteries would be too expensive for multi-day outages.

    7. Machine Learning Dispatch: Predicting load patterns to keep “Spinning Reserves” at the absolute minimum necessary level, saving fuel and wear.

    Risk Landscape and Failure Modes

    • The “Inverter Fight”: If two grid-forming inverters are not perfectly synchronized, they will “fight” each other, creating massive circulating currents that can destroy the power electronics.

    • Communication Latency: If the fiber-optic link between the BESS and the main breaker is delayed by even 50ms, the stabilization command might arrive after the system has already tripped.

    • Cyber-Physical Injection: An attacker compromising the controller could intentionally oscillate the frequency, using the microgrid’s own assets to tear it apart physically.

    Governance, Maintenance, and Long-Term Adaptation On-Site Microgrid Stabilization

    A microgrid is not a “Set-and-Forget” asset. It requires “Tuning” as the site changes.

    The “Stabilization Health” Checklist:

    • Relay Coordination Study: Annual review to ensure that the “Fastest” relay is the one closest to the fault.

    • Battery Internal Resistance Test: Monitoring for aging cells that can no longer provide the high “C-Rate” (burst power) needed for stabilization.

    • Firmware Audit: Ensuring all inverters have the latest “Fault Ride-Through” patches.

    • Island-Transition Drill: A quarterly “Live-Pull” of the main breaker to verify the system can transition without a flicker.

    Measurement, Tracking, and Evaluation

    • Leading Indicators: “Spinning Reserve Margin” (How much excess power is ready right now?); “Phase Angle Deviation” (How far are we from a sync error?).

    • Lagging Indicators: “Voltage Excursion Frequency” (How many times did we leave the +/- 5% band?); “Unscheduled Islanding Success Rate.”

    • Documentation Examples:

      1. The “Event Sequence Recorder” (SER): A millisecond-accurate log of every switch that moved during a fault.

      2. The “Power Quality Audit”: A monthly report on Total Harmonic Distortion (THD).

    Common Misconceptions and Oversimplifications On-Site Microgrid Stabilization

    • Myth: “If I have solar and a battery, I have a microgrid.” Correction: Without a high-speed controller and grid-forming inverters, you merely have a “Backup System” that will fail during the transition.

    • Myth: “Batteries are too slow for stabilization.” Correction: Modern Lithium-ion inverters can respond in sub-cycle speeds (less than 16ms), far faster than any mechanical turbine.

    • Myth: “A microgrid makes me 100% immune to outages.” Correction: Internal faults (a squirrel hitting a transformer on your site) can still take you down; stabilization only protects against systemic imbalance.

    • Myth: “I should island my microgrid all the time to be safe.” Correction: Staying tied to the grid is actually more stable; islanding should be a last resort due to the loss of utility inertia.

    Conclusion

    The engineering of On-Site Microgrid Stabilization represents the final frontier of the energy transition. As we move away from the massive, centralized turbines of the past, we are placing the burden of stability onto localized, software-defined systems. This shift demands a new level of “Electrical Intelligence”—a realization that the quality of power is just as critical as the quantity. By mastering the millisecond-scale dynamics of frequency and voltage, facilities can move beyond the role of “Consumers” and become truly resilient, self-governing nodes in a more flexible, decentralized global grid.

  • The Silicon Crucible: Engineering the Foundations of Generative Intelligence

    The Silicon Crucible: Engineering the Foundations of Generative Intelligence

    AI-ready datacenter architecture the transition from general-purpose cloud computing to accelerated, large-scale machine learning has precipitated a fundamental crisis in physical infrastructure. For decades, the datacenter was a temple of “Commodity X86” architecture—racks of servers designed for high-availability web hosting, database management, and enterprise virtualization. These facilities optimized for moderate power density, air-cooled thermal management, and standard Ethernet networking. However, the emergence of transformer models and high-parameter neural networks has rendered this traditional blueprint obsolete. We are no longer managing distributed workloads; we are engineering massive, monolithic computational clusters that behave as a single, unified organism.

    The shift toward specialized infrastructure is not merely an incremental upgrade but a structural revolution. Where a standard enterprise rack might consume 5 to 10 kilowatts (kW), a modern cluster optimized for training Large Language Models (LLMs) can easily demand 50 to 100 kW per rack. This ten-fold increase in power density creates a “Thermal Wall” that air-cooling cannot penetrate, necessitating a pivot toward liquid-to-chip cooling technologies. Furthermore, the networking requirements have shifted from the North-South traffic patterns of the internet to the East-West “All-to-All” communications required for gradient synchronization across thousands of GPUs.

    This evolution demands a new philosophy of design: the creation of a high-density, low-latency, and thermally resilient environment. To build for the future is to acknowledge that the “Average” datacenter is now a bottleneck. Achieving a truly “AI-ready” state requires a total reimagining of the power chain, the cooling loop, and the network fabric. This article serves as an editorial interrogation of those systems, moving beyond the industry hype to examine the technical frictions and structural mandates of next-generation infrastructure.

    Understanding “AI-Ready Datacenter Architecture”

    To define AI-Ready Datacenter Architecture is to describe a system designed for “Computational Density” rather than “Storage Volume.” A common misunderstanding in the executive suite is that “AI-ready” simply means adding more GPUs to existing racks. This is an oversimplification that leads to “stranded capacity”—where expensive chips sit idle because the facility cannot provide enough power to run them at peak clock speeds or enough cooling to prevent thermal throttling. A true architecture is a balanced ecosystem where the power delivery, heat rejection, and data throughput are perfectly synchronized with the duty cycle of an H100 or B200 cluster.

    From a multi-perspective view, the architecture must satisfy three conflicting stakeholders: the “Power Engineer” (who demands stability and efficiency), the “Network Architect” (who demands zero-packet-loss and sub-microsecond latency), and the “Financial Officer” (who demands a high utilization rate). The risk of oversimplification lies in focusing on any one of these pillars in isolation. For instance, a facility might have the power capacity for AI but lack the “Floor Loading” strength to support the massive weight of liquid-cooled racks and backup batteries.

    Authentic AI-Ready Datacenter Architecture operates on the principle of “Non-Blocking Scalability.” This means the network fabric must allow for “GPU-Direct” memory access across the entire cluster without hitting the bottlenecks of traditional CPU-bound networking. It also implies a “Modular Thermal Strategy” where the facility can support a mix of air-cooled legacy workloads and liquid-cooled AI clusters simultaneously. Achieving this requires a move away from rigid, fixed-plant designs toward “Flex-Power” infrastructures that can dynamically allocate energy based on the shifting training or inference demands of the model.

    Deep Contextual Background: The Historical Shift

    AI-ready datacenter architecture the history of the datacenter is a story of increasing abstraction. In the 1990s, the “Mainframe Era” focused on vertical scaling within a single box. The 2000s ushered in the “Cloud Era,” characterized by horizontal scaling across thousands of cheap, identical servers. This era was defined by “Virtualization”—the ability to slice a single server into many small, isolated environments. This worked because web traffic is “embarrassingly parallel”—one user’s request has nothing to do with another’s.

    The “AI Era” has reversed this trend. We are now seeing a return to “Unified Scaling.” In the training of a multi-trillion parameter model, the GPUs must talk to each other so frequently that the network effectively becomes the “Backplane” of a giant supercomputer. This historical pivot has caught many traditional colocation providers off guard.

    Conceptual Frameworks and Mental Models AI-Ready Datacenter Architecture

    The “Thermal Envelope” Framework

    This model treats the datacenter not as a room, but as a heat exchanger. The goal is to maximize the “Delta-T” (temperature difference) between the coolant and the heat source. In AI architecture, the “Air-to-Liquid Transition” is the primary constraint.

    The “Fabric-Centric” Mental Model

    In traditional computing, the server is the center of the universe. In AI computing, the network is the center. If the fabric fails or slows down, the GPUs “stall”—consuming power and generating heat while doing zero useful work.

    The “Energy-to-Token” Efficiency Logic

    Instead of measuring Power Usage Effectiveness (PUE) as a measure of facility overhead, this model focuses on the total energy required to generate a specific unit of inference (a “token”). This shift in logic prioritizes “Computational Efficiency” over “Cooling Efficiency.”

    Key Categories and Technical Variations

    Modern AI architecture can be categorized by how it handles the “Density Problem.”

    Category Typical Density Cooling Method Network Fabric Use Case
    High-Density Air 15–25 kW/Rack Rear-Door Heat Exchangers 400G Ethernet Large-scale Inference
    Direct-to-Chip (DTC) 40–100 kW/Rack Water-Cooled Cold Plates InfiniBand / NVLink Foundation Model Training
    Single-Phase Immersion 60–150 kW/Rack Non-conductive Oil Submerged Optics Extreme Overclocking / Research
    Two-Phase Immersion 200 kW+ / Rack Boiling/Condensing Fluid Integrated Backplane Next-Gen Ultra-Large Models

    Realistic Decision Logic

    The choice of architecture is dictated by the “Model Scale.” If a firm is performing “Fine-tuning” on existing models, High-Density Air or DTC is often sufficient. The decision is a trade-off between “Operational Familiarity” (Air) and “Future-Proofing” (Liquid).

    Detailed Real-World Scenarios AI-Ready Datacenter Architecture

    Scenario 1: The “Legacy Refit” Failure

    • The Constraint: An enterprise attempts to deploy a cluster of H100s into a 2018-era datacenter designed for 7 kW racks.

    • The Outcome: To keep the chips cool, the facility must “Checkerboard” the racks—leaving every other rack empty. This doubles the fiber optic cable lengths, introducing latency that degrades the training performance by 15%.

    • The Lesson: Physical proximity is a performance metric in AI. If you can’t cool the density, you can’t achieve the performance.

    Scenario 2: The “Over-Provisioned” Network

    • The Constraint: A provider builds a state-of-the-art liquid-cooled facility but uses standard leaf-spine Ethernet for the network.

    • Failure: During “All-Reduce” operations in model training, the network suffers from “Incast Congestion,” where many GPUs send data to one simultaneously.</p>

    • Second-Order Effect: The GPUs wait for the network, causing a “Power Spike” cycle that trips the facility’s circuit breakers due to the rapid oscillation in energy demand.</p>

    Planning, Cost, and Resource Dynamics

    The CAPEX of an AI-ready facility is significantly higher due to the specialized plumbing and power conditioning required.

    Expense Category Typical Range (per MW) Variability Factors
    Power Infrastructure $7M – $12M Battery chemistry (LiFePO4 vs. VRLA); Redundancy level
    Liquid Cooling Plant $3M – $6M CDU (Coolant Distribution Unit) capacity; Filtration
    Network Fabric $5M – $15M Fiber density; Specialized InfiniBand switching
    Civil/Structural $2M – $5M Floor reinforcement for heavy high-density racks

    Tools, Strategies, and Support Systems AI-Ready Datacenter Architecture

    1. Computational Fluid Dynamics (CFD): Essential for modeling air and liquid flow to prevent “Hot Spots” in high-density environments.

    2. Coolant Distribution Units (CDUs): The “Heart” of the liquid-cooled datacenter, managing pressure and temperature between the facility water and the rack-level fluid.</p>

    3. DCIM (Data Center Infrastructure Management): Real-time monitoring of power and thermals at the “Socket Level” to predict failures before they occur.</p>

    4. RDMA (Remote Direct Memory Access): A protocol strategy that allows GPUs to share data without involving the server’s CPU, crucial for low-latency clusters.</p>

    5. Smart PDUs (Power Distribution Units): Capable of handling high-amperage loads and providing the granular data needed for “AI Duty Cycle” management.</p>

    6. Busway Power Distribution: Replacing traditional overhead cabling with rigid busways to accommodate the massive current required for 100 kW racks.

    7. Harmonic Mitigation Transformers: Specialized electrical equipment to clean up the “Electrical Noise” generated by thousands of high-speed power supply units.

    Risk Landscape and Failure Modes

    The “AI-Ready” environment introduces “Compounding Risks” that do not exist in standard facilities.

    • Thermal Runaway: In a 100 kW rack, if the cooling pump fails, the temperature can rise to destructive levels in less than 60 seconds. There is virtually no “Thermal Mass” to absorb the heat once the liquid stops moving.

    • Vibration-Induced Disk Failure: High-velocity cooling fans (needed to move air through dense racks) can create acoustic vibrations that cause traditional hard drives to fail. In an AI facility, the storage must be almost entirely NVMe/Flash.

    • The “Water Leak” Nightmare: Introducing liquid into the server room creates a risk of catastrophic shorts. This necessitates “Leak Detection Cables” and non-conductive dielectric fluids for immersion systems.

    Governance, Maintenance, and Long-Term Adaptation AI-Ready Datacenter Architecture

    Maintaining an AI-Ready Datacenter Architecture requires a shift from “Break-Fix” to “Predictive Maintenance.”

    The “High-Density” Checklist:

    • Fluid Chemistry Audit: Monthly testing of cooling fluids for “Bio-fouling” or chemical degradation that could clog the micro-channels on the chip’s cold plate.</p>

    • Power “Step-Load” Testing: Simulating the sudden jump from 10% to 100% GPU load to ensure the facility’s UPS and generators can handle the massive transient surge.</p>

    • Optical Fiber Inspection: In 400G/800G environments, even a microscopic speck of dust on a fiber connector can cause enough signal loss to crash a training run.</p>

    • Seismic and Floor Stress Reviews: Regularly assessing the structural integrity of the floor as racks get heavier with the addition of liquid manifolds and heat exchangers.</p>

    Measurement, Tracking, and Evaluation

    • Leading Indicators: “Return Temperature Index” (RTI) for air; “Coolant Approach Temperature” for liquid systems. These tell you if the cooling system is becoming less efficient before a failure occurs.

    • Lagging Indicators: “Effective FLOPs per Watt”—a measure of how much actual math was performed for every unit of energy consumed.</p>

    • Documentation Examples:

      1. The “Heat Map” History: A 24/7 visual record of thermal fluctuations across the cluster.

      2. The “Fabric Congestion” Log: Tracking how often the GPUs were waiting for the network, used to optimize the “Topology” of the next cluster.</p>

    Common Misconceptions and Oversimplifications AI-Ready Datacenter Architecture

    • Myth: “PUE is the only metric that matters.” Correction: A low PUE (near 1.0) is useless if your chips are thermal-throttling and only running at 70% of their potential performance.</p>

    • Myth: “Cloud AI is always better than On-Premise.” Correction: For massive, persistent training runs, the “Data Egress” costs and the premium charged by cloud providers often make building a private AI-ready facility more economical over a 3-year horizon.</p>

    • Myth: “Ethernet is too slow for AI.” Correction: With the advent of Ultra Ethernet and RoCE v2, Ethernet is becoming competitive with InfiniBand for all but the most latency-sensitive training tasks.</p>

    • Myth: “Liquid cooling is too expensive/dangerous.” Correction: At densities above 30 kW per rack, liquid cooling is actually cheaper than the electricity cost of running the massive fans required for air cooling.</p>

    Ethical and Practical Considerations

    Building AI infrastructure consumes massive amounts of energy and water. The “Ethical Architect” must consider the “Water Scarcity” of the local region. A facility that uses “Evaporative Cooling” to stay efficient might consume millions of gallons of water a day, potentially straining local resources. The move toward “Closed-Loop” liquid cooling and “Heat Reuse” (using the datacenter’s waste heat to warm nearby buildings) is no longer a PR move—it is a requirement for community acceptance and long-term regulatory compliance.</p>

    Conclusion AI-Ready Datacenter Architecture

    The architecture of the datacenter has reached its most significant inflection point since the invention of the microprocessor. Building for AI is not an act of “Adding Capacity” but an act of “Engineering Physics.” The successful AI-Ready Datacenter Architecture is one that respects the laws of thermodynamics, signal integrity, and fluid dynamics as much as it respects the code of the models it hosts. As we push toward “General Intelligence,” the facility itself becomes a vital part of the algorithm—the silent, silicon foundation upon which the future of computing is being written.</p>

  • The Regulatory Labyrinth: A Systemic Inquiry into Entitlement Security

    The Regulatory Labyrinth: A Systemic Inquiry into Entitlement Security

    How to avoid permit risk in the theater of capital improvement and infrastructure development, the permit is often viewed as a mere administrative hurdle—a bureaucratic “check-the-box” exercise to be completed before the real work begins. This perspective is a fundamental miscalculation of project risk. In reality, the permitting process is a complex, multi-jurisdictional negotiation that sits at the intersection of public safety, environmental law, and municipal politics. To navigate this landscape without a rigorous strategy is to invite catastrophic delays that can erode profit margins, trigger legal disputes, and, in extreme cases, render a project fundamentally non-viable.

    The concept of “Permit Risk” encompasses the probability that a project will be denied necessary authorizations, face significant unexpected conditions for approval, or suffer from debilitating chronological lag in the review cycle. This risk is not a static variable; it is a dynamic pressure that scales with the complexity of the project and the sensitivity of the site.

    This requires a transition from a reactive “apply and wait” posture to a proactive “Compliance Engineering” model. By identifying the “Critical Path” of entitlements early and engaging with regulatory stakeholders as technical partners rather than adversaries, an organization can effectively insulate its capital from the volatility of municipal bureaucracy. This article provides a comprehensive interrogation of the mechanics of entitlement, moving beyond basic checklists to examine the structural strategies required for long-term project resilience.

    Understanding “how to avoid permit risk”

    The endeavor of how to avoid permit risk is frequently misunderstood as a pursuit of “Faster Approvals.” While speed is a desirable byproduct, the primary goal of risk avoidance is “Predictability.”

    Oversimplification in this domain often leads to the “Single-Jurisdiction Fallacy.” Many developers focus exclusively on the primary building permit issued by a city, ignoring the “Sub-Entitlements” required by regional water boards, departments of transportation, or historical commissions. Each of these agencies operates on its own timeline and with its own—often conflicting—criteria. To truly master how to avoid permit risk, one must map the “Interdependency Matrix” of these approvals. A failure to secure a secondary drainage permit can halt the primary building permit, creating a “Deadlock Scenario” that freezes capital and labor.

    Furthermore, there is a risk in treating code compliance as a binary “Yes/No” state. In high-stakes development, the “Discretionary Power” of plan examiners and local boards introduces a level of subjectivity. Understanding the intent behind the code, rather than just the literal text, allows for a more effective negotiation.

    Deep Contextual Background: The Evolution of Regulatory Oversight

    How to avoid permit risk the modern permitting system in the United States is a far cry from the rudimentary zoning and safety checks of the early 20th century. However, the mid-20th century saw the introduction of broader “Social and Environmental Controls.” The National Environmental Policy Act (NEPA) and various state-level equivalents transformed the permit from a structural certification into an environmental and social impact assessment.

    We have now entered the era of “Holistic Entitlement. This expansion of scope has increased the “Surface Area” of permit risk. A project is no longer judged solely on whether the walls will stand, but on its impact on the local watershed, the carbon footprint of its materials, and its effect on neighborhood gentrification.

    This evolution has also changed the “Timeline of Certainty.”This systemic shift has made “Regulatory Fortification”—ensuring the administrative record is ironclad—a central pillar of the development process.

    Conceptual Frameworks and Mental Models How To Avoid Permit Risk

    The “Critical Path of Entitlement” (CPE)

    This framework involves identifying the specific approval that has the longest lead time and the most dependencies. By prioritizing the “Long-Pole” permits (often environmental or zoning variances) rather than the “Easy” permits, the developer ensures that the project schedule isn’t bottlenecked at the 11th hour.

    The “Regulatory Convergence” Model

    Most permits are not isolated; they converge on specific technical requirements. For example, a building’s footprint affects storm-water runoff, which affects environmental permits, which affects site-plan approval. This mental model encourages “Cross-Disciplinary Engineering,” where the architect, civil engineer, and permit expeditor work in a single feedback loop to ensure a change in one area doesn’t trigger a “Cascading Denial” in another.

    The “Stakeholder Influence Map”

    Permit risk is not just technical; it is political. This model categorizes stakeholders into “Decision Makers” (Plan Examiners), “Influencers” (Neighborhood Associations), and “Veto Actors” (Environmental Agencies). Mapping these groups allows the developer to customize their communication strategy, addressing the specific concerns of each group before those concerns become formal objections.

    Key Categories of Permit Hazards

    Navigating the landscape of how to avoid permit risk requires a triage of the various “Friction Points” in the regulatory process.

    Hazard Category Primary Trigger Mitigation Strategy Risk Magnitude
    Zoning Incompatibility Use-case doesn’t match local land use Seek variance or “Special Use” permit High (Potential Project Killer)
    Environmental Discovery Wetlands, endangered species, or toxins Phase 1 & 2 Environmental Site Assessments High (Major Schedule Delay)
    Infrastructure Capacity Overburdened sewer, power, or traffic “Off-site Improvement” proffer Moderate (Unplanned Cost)
    Code Interpretation Subjective examiner judgment Pre-submittal meetings & code analysis Low (Minor Technical Revision)
    Public Opposition Neighborhood noise or traffic concerns Community outreach and “Visual Impact” studies Variable (Political Risk)

    Realistic Decision Logic

    When a conflict arises between a project’s design and a permit requirement, the decision logic must be: “Is the delay cost of a variance greater than the redesign cost of compliance?” In 80% of cases, redesigning for strict compliance is more cost-effective than engaging in a multi-year legal battle for a variance, even if the variance would technically allow for a slightly better product.

    Detailed Real-World Scenarios How To Avoid Permit Risk

    The “Zoning Variance” Stall

    • The Constraint: A developer plans an office-to-residential conversion in a district zoned for commercial-only use.

    • The Error: Applying for a full re-zoning without a pre-negotiated “Development Agreement.”

    • The Outcome: Neighborhood activists use the public hearing to block the project, citing “Character of the Neighborhood.” The project sits in limbo for 24 months, accruing $2M in interest.

    • Mitigation: Pursuing a “PUD” (Planned Unit Development) which offers specific community benefits in exchange for flexible zoning, often smoothing the path to approval.

    The “Overlooked Easement”

    • The Constraint: A warehouse expansion is planned over what appears to be empty land.

    • The Discovery: Mid-review, an examiner identifies an unrecorded municipal utility easement running through the center of the proposed foundation.

    • Failure: The permit is denied because the building would block access to a critical water main.

    Planning, Cost, and Resource Dynamics

    The “Soft Costs” of permitting—fees, consultants, and legal—are often underestimated in initial pro-formas.

    Cost Element Estimated Range (USD) Variability Factor
    Expediting Fees $2,000 – $15,000 Complexity and speed of jurisdiction
    Civil/Environmental Studies $5,000 – $50,000+ Site history and sensitive features
    Traffic Impact Analysis $3,500 – $12,000 Projected trip-generation metrics
    Public Relations/Legal $500 – $2,500 per hour Intensity of local opposition

    Tools, Strategies, and Support Systems

    1. Permit Expediters: Local specialists who understand the “Unwritten Rules” of a specific building department.

    2. Code Compliance Software: Automated checks that compare CAD drawings against current IBC (International Building Code) standards.

    3. Title Reports & ALTA Surveys: Essential for identifying easements and encroachments that trigger permit denials.

    4. “Stop-Work” Insurance: Specialized policies that protect against financial loss due to permit revocations or administrative delays.

    5. Community Liaison Officers: Professionals who manage neighborhood expectations to prevent “NIMBY” (Not In My Backyard) opposition.

    6. “Peer Review” Consultants: Third-party engineers who audit a permit package before it is submitted to the city, catching “Low-Hanging” errors.

    Risk Landscape and Failure Modes How To Avoid Permit Risk

    Permit risk is rarely a single event; it is a “Compounding Cascade.”

    • Agency Deadlock: When Agency A (Transportation) requires a wider road, but Agency B (Environmental) forbids any more impervious surface. This creates a “Logical Impossible State” that can only be resolved through high-level political mediation.

    • The “Administrative Error” Revocation: A permit is issued, construction starts, but a procedural error is discovered in how the public notice was posted. The permit is revoked mid-construction, leading to a total loss of the structure if the error cannot be cured.

    Governance, Maintenance, and Long-Term Adaptation

    For long-term projects (5-10 years), the permit strategy must include “Regulatory Monitoring.”

    The “Entitlement Maintenance” Checklist:

    • Expiration Tracking: Monitoring the “Sunset Clause” on every permit. Most permits expire if construction doesn’t start within 6-12 months.

    • Inspection Coordination: Ensuring that “Special Inspections” (e.g., soil compaction or steel welding) are documented exactly as the permit requires. Failure to document an inspection can lead to a “Denial of Certificate of Occupancy” at the very end.

    • Code Update Audits: Reviewing project plans every 6 months against any new “Code Cycles” adopted by the municipality.

    Measurement, Tracking, and Evaluation How To Avoid Permit Risk

    • Leading Indicators: “Days in Review” vs. “Jurisdictional Average”; the ratio of “Comments per Sheet” (more comments = poorly prepared submittal).

    • Lagging Indicators: “Total Change Orders” caused by permit-required design changes; “Interest Expense” incurred during the permitting delay.

    • Documentation Examples:

      1. The “Permit Tracker”: A centralized dashboard showing every active permit, its expiration date, and current status.

      2. The “Correction Response Letter”: A formal document mapping every city comment to a specific change in the drawings, ensuring the examiner doesn’t have to “Hunt” for the fix.

    Common Misconceptions and Oversimplifications

    • Myth: “Getting a permit is the architect’s job.” Correction: The architect manages the drawings, but the “Entitlement Strategy” is a business management function that involves legal, financial, and political coordination.

    • Myth: “You can always get a variance if you have a good reason.” Correction: Variances are legally defined as “Hardships.” Financial inconvenience is almost never a legal “Hardship.”

    • Myth: “The city has to approve it if I follow the code.” Correction: Many approvals (especially in “Historic Districts”) are “Discretionary,” meaning the board can deny the project based on “Aesthetics” or “General Welfare.”

    • Myth: “I can start ‘Early Grading’ without a full permit.” Correction: Starting any work without a specific “Early Start” permit can lead to immediate “Stop-Work Orders” and permanent blacklisting by local examiners.

    Ethical and Practical Considerations How To Avoid Permit Risk

    The pursuit of how to avoid permit risk must be balanced with the “Social License to Operate.” While it may be legally possible to circumvent certain local concerns through a technical loophole, the long-term reputation of a developer is built on “Regulatory Integrity.” A developer who constantly fights the building department or ignores neighborhood feedback will find that their next project faces 10x more scrutiny.

    Conclusion

    The mitigation of permit risk is not an act of bureaucratic evasion, but a commitment to “Technical Rigor” and “Strategic Foresight.” As the regulatory environment becomes more fragmented and specialized, the ability to secure entitlements predictably will become the primary differentiator between successful projects and financial failures. By treating the permit as a “Dynamic Structural Element”—as vital as the concrete and steel—project leaders can navigate the complexities of municipal oversight and deliver assets that are both compliant and highly profitable.

  • The Strategic Blueprint: Navigating the Fiscal Realities of Site Transformation

    The Strategic Blueprint: Navigating the Fiscal Realities of Site Transformation

    How to plan land development on a budget the conversion of raw acreage into a functional, value-generating asset is a process frequently romanticized but rarely analyzed with the necessary financial rigor. In the current economic climate, characterized by tightening credit markets and escalating material costs, land development has shifted from a speculative endeavor into a precision-engineered management task.

    To approach a plot of land with the intent of improvement is to enter into a complex negotiation with local topography, municipal zoning, and ecological constraints. For the private developer or the small-scale investor, the challenge is amplified by a lack of institutional economies of scale. Budgetary constraints are not merely obstacles; they are the primary architects of the project’s scope. Effective land planning requires a shift from a “vision-first” mentality to a “constraint-based” methodology, where the physical characteristics of the site dictate the financial boundaries of the build.

    The nuance of low-cost development lies in “Pre-emptive Problem Solving.” Every hour spent in the conceptual and permitting stage is an investment against the high-interest carry costs of construction delays. Understanding the systemic interactions between civil engineering, environmental regulations, and utility infrastructure is the only way to avoid the “Financial Quicksand” of unforeseen site work. This article provides a comprehensive editorial interrogation of the mechanics of site optimization, moving beyond superficial cost-saving tips to examine the structural strategies required for lean, high-authority land development.

    Understanding “how to plan land development on a budget”

    The pursuit of how to plan land development on a budget is often mischaracterized as a search for “cheap” labor or materials. In the professional editorial sphere, this objective is more accurately defined as “Capital Efficiency Optimization.” A common misunderstanding among novice developers is the belief that the cheapest parcel of land will yield the lowest development cost. In reality, a “bargain” plot often carries hidden liabilities—such as excessive slopes, poor soil bearing capacity, or the absence of utility “stub-outs”—that can quadruple the site-prep budget.

    Oversimplification risks are prevalent in “DIY” development circles, where there is a tendency to overlook the “Soft Costs” of permitting and environmental impact studies. To truly master how to plan land development on a budget, one must adopt a “Subterranean-First” perspective. A budget-conscious plan prioritizes working with the natural topography rather than fighting it through massive “Cut-and-Fill” operations.

    Furthermore, the “Modularization of Progress” is a critical conceptual shift. Instead of viewing a development as a single, massive expenditure, the expert planner views it as a series of “Phased Milestones.” This systemic approach ensures that the developer remains agile, able to pivot or pause without the catastrophic loss of unallocated resources.

    Contextual Evolution: From Unregulated Sprawl to Strategic Infill

    How to plan land development on a budget historically, land development in the United States was a process of expansion. The shift toward “Smart Growth” and density-driven zoning has introduced new layers of regulatory complexity. Environmental protection acts, storm-water management mandates (such as the Clean Water Act), and ADA compliance requirements have made the “budget” developer’s job significantly more difficult. Today, the cost of land is often secondary to the cost of “Entitlement”—the legal right to develop the land for a specific use.

    Conceptual Frameworks and Mental Models How To Plan Land Development On A Budget

    The “Topographical Lean” Framework

    This model posits that the most expensive action a developer can take is moving dirt. The “Lean” approach mandates that the building footprint and access roads follow the natural contours of the land. This minimizes the need for retaining walls and complex drainage systems, which are among the highest per-linear-foot costs in site development.

    The “Utility Gravity” Model

    Infrastructure is governed by the laws of physics. Water and sewage systems are significantly cheaper when they can rely on gravity rather than mechanical lift stations. A budget-conscious plan identifies the “Natural Drainage Outfall” and positions the high-density components of the project in alignment with existing municipal connections.

    The “Entitlement De-risking” Matrix

    This mental model separates the development process into “Paper Value” and “Physical Value.” The most significant value jump in land development occurs when a piece of raw land becomes “Permitted.” A budget plan focuses heavily on increasing paper value through zoning changes and site-plan approvals before a single shovel enters the ground, as this creates a “Collateralizable Asset” that can attract lower-interest financing.

    Key Categories of Land Transformation

    Identifying the specific nature of a site determines the applicable cost-saving levers.

    Site Category Primary Cost Driver Budget Optimization Strategy Trade-off
    Urban Infill Utility Tap Fees / Demolition Leverage existing “Stub-outs” Limited design flexibility
    Rural Greenfield Access Roads / Well & Septic Cluster development to reduce piping High environmental scrutiny
    Sloped Terrain Retaining Walls / Erosion “Stilt” foundations or stepped slabs Increased structural engineering cost
    Reclaimed/Industrial Remediation / Soil Quality “Capping” vs. Total Removal Long-term liability monitoring

    Realistic Decision Logic

    When evaluating how to plan land development on a budget, the decision logic should be: Does this expenditure increase the “Yield per Acre” or merely the “Aesthetics per Acre”? On a restricted budget, yield (the number of buildable units or functional square footage) must always take precedence. If a luxury entrance adds 5% to the cost but 0% to the density, it is discarded in the planning phase.

    Detailed Real-World Scenarios How To Plan Land Development On A Budget

    The “Utility Extension” Trap

    • The Decision Point: Should the developer pay for the extension or use an on-site septic system?

    • Analysis: Extending municipal lines often triggers “Downstream Capacity Upgrades” that the developer must fund.

    • Resolution: If local codes allow, a “Clustered Septic” system may be 60% cheaper, though it limits total density. The budget plan selects the system that avoids “Off-site Infrastructure” costs.

    The “Over-Engineered” Roadway

    • The Constraint: Local ordinances require a 24-foot wide paved road for a small 4-unit subdivision.

    • The Second-Order Effect: Pavement increases “Impervious Surface” ratios, requiring a massive, expensive storm-water retention pond.

    • Action: Negotiate a “Lesser Standard” or use permeable pavers. Reducing the road width by just 4 feet can reduce the storm-water management budget by 20%.

    Planning, Cost, and Resource Dynamics

    The “Shadow Costs” of land development—taxes, insurance, and interest—are the “Silent Killers” of a budget.

    Phase of Development Direct Cost (Range) Variable Factors
    Feasibility/Survey $5,000 – $15,000 Boundary complexity; tree surveys
    Engineering/Site Plan $10,000 – $40,000 Grading requirements; storm-water calcs
    Permitting/Fees $2,000 – $25,000 Municipal “Impact Fees”
    Site Prep (Mobilization) $5,000 – $20,000 Equipment transport; clearing and grubbing

    Tools, Strategies, and Support Systems How To Plan Land Development On A Budget

    1. GIS (Geographic Information Systems): Using free municipal GIS layers to identify flood zones, wetlands, and soil types before paying for a professional survey.

    2. Shared Infrastructure Agreements: Partnering with adjacent landowners to share the cost of a main road or utility trunk line.

    3. Low-Impact Development (LID) Techniques: Using natural bioswales and rain gardens instead of concrete pipes to manage run-off.

    4. Phased Clearing: Clearing only the “Building Envelope” to preserve existing vegetation, which reduces both clearing costs and future landscaping expenses.

    5. In-Situ Material Reuse: Crushing on-site rock for road base rather than hauling it away and buying new gravel.

    6. Owner-Representative Management: Acting as the “Primary Coordinator” to eliminate the 10-15% “General Conditions” fee charged by large development firms.

    Risk Landscape and Failure Modes

    The primary risk in low-budget development is “The Permit Stall.” Carrying a loan on land for 18 months while waiting for a zoning variance can consume the entire profit margin.

    • Taxonomy of Failure:

      • Regulatory: Discovering an endangered species or archeological artifact mid-clearing.

      • Geotechnical: Hitting “Blue Rock” or an underground spring that wasn’t caught in the initial boring.

    Governance, Maintenance, and Long-Term Adaptation How To Plan Land Development On A Budget

    A budget development plan must include a “Stewardship Protocol” to ensure the site doesn’t degrade during the construction hiatus.

    The “Site Preservation” Checklist:

    • Erosion Control: Silt fences and hydro-seeding must be maintained monthly to avoid municipal fines.

    • Security: Fencing and “No Trespassing” signage to prevent illegal dumping, which can lead to expensive remediation costs.

    • Tax Management: Applying for “Agricultural Exemption” or “Timber Stand” status during the planning phase to reduce holding costs.

    Measurement, Tracking, and Evaluation

    • Leading Indicators: The ratio of “Planned vs. Actual” permitting days; the number of “Cycles of Revision” required by the planning commission.

    • Lagging Indicators: Total “Cost per Buildable Square Foot”; the “Residual Land Value” after entitlements are secured.

    • Documentation Examples:

      1. The “Site Log”: A daily record of weather and site conditions to justify “Rain Day” extensions with contractors.

      2. The “Yield Analysis”: A spreadsheet comparing the ROI of different density configurations.

    Common Misconceptions and Oversimplifications How To Plan Land Development On A Budget

    • Myth: “You can save money by skipping the soil test.” Correction: A $3,000 soil test can save $50,000 in foundation redesigns.

    • Myth: “Buying land in a remote area is always cheaper.” Correction: The cost of bringing power and internet miles into the woods often exceeds the “savings” on the land price.

    • Myth: “I can do my own clearing with a rented skid-steer.” Correction: Professional operators with heavy machinery can clear in 2 days what a novice takes 2 weeks to do, often with less damage to the “Topsoil Integrity.”

    • Myth: “Zoning is fixed.” Correction: Zoning is a “Negotiable Framework.” Proposing a “Planned Unit Development” (PUD) can allow for smaller lots and higher yields if the developer provides a community benefit like a public trail.

    Conclusion

    The successful execution of how to plan land development on a budget is an exercise in “Strategic Restraint.” It requires the developer to resist the urge for immediate physical progress in favor of meticulous, often tedious, analytical preparation. By prioritizing the natural mechanics of the site—gravity, topography, and soil—and navigating the regulatory landscape with surgical precision, one can transform raw land into a high-value asset without the burden of excessive capital expenditure. The “Budget” is not a limitation; it is a discipline that forces a higher level of engineering and management excellence.

  • The Structural Anchor: Navigating the Complexities of Substrata Stabilization

    The Structural Anchor: Navigating the Complexities of Substrata Stabilization

    Common foundation repair mistakes the integrity of a building is fundamentally a negotiation with the soil beneath it. While architectural aesthetics capture the public imagination, the structural viability of any significant asset rests upon a hidden, subterranean system that must reconcile the rigid requirements of masonry with the fluid, shifting dynamics of geology. In the United States, where diverse soil profiles range from the expansive clays of the Sunbelt to the frost-susceptible silts of the North, foundation management is less a matter of “fixing” and more an exercise in forensic engineering and environmental adaptation.

    To address the failure of a foundation is to engage with a high-stakes, low-visibility problem where the margin for error is razor-thin. Unlike a roof leak or a localized plumbing failure, a compromised foundation threatens the “Geometrical Sanity” of the entire structure. A differential settlement of just one inch can initiate a cascading failure of the building’s envelope, compromising window seals, distorting door frames, and fracturing the rigid bonds of the interior finishes. Consequently, the remediation of these issues requires a sophisticated understanding of “Hydraulic Loading” and “Soil-Structure Interaction.”

    In the current market, the pressure to find rapid, cost-effective solutions has led to an uptick in reactive repairs that fail to address the root systemic causes. Many property owners and managers view foundation work through the lens of a “commodity purchase,” assuming that all piers, piles, and stabilization methods are interchangeable. This perspective is fundamentally flawed. A successful intervention requires a diagnostic rigor that accounts for the historical drainage patterns of the site, the chemistry of the local water table, and the long-term seismic or climatic projections for the region. This article provides a definitive, editorial interrogation of the pitfalls inherent in this sector, moving beyond superficial remedies to examine the systemic realities of structural stabilization.

    Understanding “common foundation repair mistakes”

    To categorize common foundation repair mistakes effectively, one must distinguish between “Application Errors” and “Diagnostic Failures.” An application error occurs when a technician installs a high-quality pier incorrectly—perhaps failing to reach the necessary torque or load-bearing strata. However, the more catastrophic and expensive errors are diagnostic. This involves a fundamental misunderstanding of why the foundation is moving. For example, installing rigid piers under a home that is experiencing “Heave” (soil expansion) rather than “Settlement” (soil contraction) can actually exacerbate the structural damage by creating localized pressure points that snap the footings.

    Oversimplification risks are particularly high in the sales-driven side of the industry. Many companies specialize in a single “productized” solution—such as pressed concrete pilings or helical anchors—and attempt to apply that solution to every scenario they encounter. From a professional editorial perspective, this is a “Hammer-and-Nail” fallacy. A homeowner who assumes a “Lifetime Warranty” on a specific pier type is a substitute for a comprehensive drainage plan is making one of the most common foundation repair mistakes. A warranty on a pier does not protect the house if the pier was the wrong choice for that specific soil chemistry.

    Furthermore, the “Localized Focus” error is rampant. Owners often focus exclusively on the corner of the house where the crack is visible, ignoring the fact that the entire foundation acts as a single, monolithic unit. Lifting one corner without accounting for the “Torsional Stress” placed on the rest of the slab can result in new, more severe fractures in areas that were previously stable.

    Contextual Evolution: From Stone Footings to Engineered Piers

    Common foundation repair mistakes the history of foundation construction in the U.S. has moved from “Gravity-Based” systems to “Deep-Foundation” engineering. Early American structures utilized stacked stone or brick footings that relied on massive weight and broad footprints to distribute loads. These systems were surprisingly resilient because they were “Flexible”—they could accommodate minor shifts in the earth without catastrophic cracking. However, they were limited to the shallow, stable soils of specific regions.

    As construction moved into more “Marginal” lands—floodplains, expansive clay zones, and reclaimed wetlands—the industry pivoted toward reinforced concrete slabs and deep-driven pilings. The mid-century boom introduced the “Slab-on-Grade” as a cost-effective standard, but it also created a new class of vulnerability. These rigid slabs are highly sensitive to “Differential Settlement,” where one part of the soil dries out faster than the other.

    Today, we are in the era of “Precision Stabilization.” Modern repairs utilize hydraulic synchronized lifting systems and high-capacity steel piers that can be driven hundreds of feet to hit bedrock or “Competent Strata.” Yet, despite these technological leaps, the human element—the diagnostic judgment of the engineer—remains the most critical variable. The evolution of the field has taught us that we cannot “Out-Engineer” the soil; we must instead design systems that can exist in a state of “Dynamic Equilibrium” with the changing moisture levels of the earth.

    Conceptual Frameworks and Mental Models Common Foundation Repair Mistakes

    The “Active Zone” Framework

    This model posits that soil only moves significantly within a certain depth (the “Active Zone”), which is influenced by seasonal evaporation and rain. Most foundation failures occur because the original footings were placed within this zone. A successful repair must bypass the Active Zone entirely, anchoring the structure in stable, moisture-independent depths.

    The “Hydraulic Path” Mental Model

    In this framework, the foundation is viewed as an obstacle in the natural flow of water. Most foundation issues are actually “Water Management” issues. This model forces the owner to ask: “Where is the water going when it hits the ground?” If the repair doesn’t solve the hydraulic path (e.g., through French drains or swales), the soil will continue to shift, rendering any mechanical lift temporary.

    The “Slab as a Beam” Logic

    This model treats a concrete slab not as a flat surface, but as a structural beam. When the soil beneath a section of the slab erodes or shrinks, that section becomes “Unsupported,” and the slab must act as a beam to span the gap. If the span is too long, the beam (slab) fails. Understanding this helps avoid the mistake of “Under-Piering,” where piers are placed too far apart, causing the slab to sag or “festoon” between the supports.

    Typologies of Foundation Failure and Repair Choices

    Understanding the trade-offs between different repair methods is essential for avoiding long-term asset depreciation.

    Method Best Use Case Primary Trade-off Failure Mode
    Pressed Concrete Pilings Stable, non-expansive soils High friction; may not reach depth “Shingling” (piles tilting out of alignment)
    Steel Helical Piers Light structures / Tension loads Lower weight capacity than push piers “Screw-off” in rocky soils
    Hydraulic Push Piers Heavy residential / Commercial High cost; requires heavy structure Foundation “punch-through” if slab is weak
    Polyurethane Injection Leveling sunken slabs / Void filling Does not provide structural support Over-lifting; blocking underground utilities

    Realistic Decision Logic

    The choice of repair must be dictated by a “Soil Boring Report.” Without knowing exactly what is 30 feet below the surface, any repair choice is a gamble. If the report shows “Fat Clays,” the logic dictates a steel pier that can bypass the clay. If the report shows stable sand but a localized void from a pipe leak, polyurethane injection may be the most efficient, non-invasive path.

    Detailed Real-World Scenarios Common Foundation Repair Mistakes

    The “Dry-Weather” Fix

    • The Constraint: A homeowner notices cracks during a severe drought and hires a company to lift the house.

    • The Error: Lifting the house when the soil is at its most “Shrunken” state.

    • The Outcome: When the rains return, the expansive clay swells, pushing the newly lifted foundation even higher (“Heave”), resulting in catastrophic interior damage and doors that will no longer close.

    • The Lesson: Professional stabilization should ideally occur when soil moisture is at a “Median” level, or must be calculated based on the soil’s potential for expansion.

    The “Partial Piering” Cascade

    • The Constraint: A budget-conscious owner only piers the back wall of a house where the most visible sinking occurred.

    • The Second-Order Effect: The back wall is now “Fixed” to the bedrock, while the front of the house remains “Floating” on the active soil.

    • Failure: As the front of the house continues to settle naturally, the house begins to “Pivot” on the new back piers, creating a massive structural tear through the center of the building.

    Planning, Cost, and Resource Dynamics

    The “Total Cost of Repair” includes not just the piers, but the “Restoration of Integrity” (plumbing, drywall, landscaping).

    Expense Category Typical Range (USD) Variability Factors
    Engineering Report $500 – $2,500 Independent PE vs. “In-house” tech
    Pier Installation $800 – $2,500 (per pier) Depth, accessibility, and material
    Plumbing Testing $300 – $1,500 Static leak tests post-lift
    Landscape/Hardscape Repair $1,000 – $10,000+ Driveway demolition and plant replacement

    Tools, Strategies, and Support Systems

    1. Independent Structural Engineers: The most critical “tool” is an engineer who does not sell repair services, providing an unbiased scope of work.

    2. Manometers (Zip Levels): Precision altimeters used to map the floor’s topography to within 1/10th of an inch.

    3. Root Barriers: Physical or chemical shields installed to prevent large trees from “sucking” the moisture out from under the foundation (Transpiration).

    4. Slab Brackets: Heavy-duty steel plates that transfer the building’s weight from the concrete to the pier without “Spalling” the slab edge.

    5. Ground Penetrating Radar (GPR): Used to locate voids or buried utilities before drilling or driving piles.

    6. Torque Monitoring Systems: Digital readouts that ensure a helical pier has reached the “Competent Soil” specified in the engineering plan.

    Risk Landscape and Failure Modes Common Foundation Repair Mistakes

    The primary risk in foundation work is “Compounding Errors.” A plumbing leak leads to soil erosion; the erosion leads to foundation settlement; the settlement snaps the sewer line; the leaking sewer line further saturates the soil, accelerating the settlement.

    • Taxonomy of Failure:

      • Operational: Pier depth not reached due to “False Refusal” (hitting a rock instead of bedrock).

      • Fiduciary: Mechanic’s liens from sub-contractors if the primary repair company is financially unstable.

      • Systemic: Fixing the “Settlement” but ignoring the “Source” (e.g., a city water main leak or poor neighborhood drainage).

    Governance, Maintenance, and Long-Term Adaptation

    Foundation health is a “Lifecycle Management” task. Once a repair is completed, the site must be “Governed” to prevent a recurrence.

    The “Foundational Integrity” Checklist:

    • Gutters and Downspouts: Ensure they discharge at least 5–10 feet away from the foundation. This is the #1 defense against common foundation repair mistakes.

    • Soaker Hoses: In expansive clay regions, maintaining a consistent (not saturated) moisture level around the perimeter during droughts to prevent the soil from pulling away from the slab.

    • Grade Assessment: Annually check that the soil slopes away from the house (at least 6 inches of drop over 10 feet).

    • Crack Monitoring: Utilizing “Crack Tell-Tale” gauges to determine if a fracture is “Active” (moving) or “Dormant.”

    Measurement, Tracking, and Evaluation Common Foundation Repair Mistakes

    • Leading Indicators: Changes in the “Closing Effort” of interior doors; new “Stair-step” cracks in exterior brickwork; separation of the chimney from the main structure.

    • Lagging Indicators: The “Floor Levelness Survey” results over a 5-year period; the frequency of “Plumbing Blockages” (often caused by pipe shearing).

    • Documentation Examples:

      • Pre-Lift/Post-Lift Elevation Maps: A clear record of exactly how much the house was moved.

      • Pier Depth Logs: A certified record of how deep each pier was driven, essential for future resale and warranty claims.

    Common Misconceptions and Oversimplifications

    • Myth: “Cracks in the drywall always mean foundation failure.” Correction: Most homes experience “Seasonal Cycling” or “Thermal Expansion” that causes minor cosmetic cracking. A professional assessment distinguishes these from structural failures.

    • Myth: “You should always lift the house back to perfectly level.” Correction: In older homes, the structure has “Settled” into its shape. Lifting it back to level can shatter the plumbing and the roof. Often, “Stabilization” (stopping the movement) is safer than “Correction” (reversing the movement).

    • Myth: “The pier with the highest weight capacity is the best.” Correction: If the concrete footing is weak, a high-capacity pier will simply “Punch through” the slab like a nail through cardboard. The system is only as strong as its weakest link.

    • Myth: “Tree roots push the foundation up.” Correction: It is usually the opposite. Roots remove the water, causing the soil to shrink and the foundation to sink.

    Conclusion Common Foundation Repair Mistakes

    Addressing the stability of a structure requires a transition from a “Fix-It” mentality to an “Investigative” one. By prioritizing independent engineering, comprehensive water management, and deep-strata anchoring, property owners can protect their most significant assets from the relentless dynamics of the earth. A foundation repair is not merely a construction project; it is a permanent alteration of the building’s relationship with its environment—one that demands technical precision, intellectual honesty, and long-term stewardship.

  • The Equilibrium of Human Capital: A Systemic Inquiry into Workforce Optimization

    The Equilibrium of Human Capital: A Systemic Inquiry into Workforce Optimization

    How to reduce labor cost in the contemporary economic landscape, labor remains the most volatile and significant expenditure on the corporate balance sheet. However, the traditional approach to cost containment—often a reactive, broad-based reduction in headcount—is increasingly viewed as a failure of strategic foresight. Modern organizational leadership has shifted toward a “Total Workforce Optimization” philosophy, recognizing that labor is not a static expense but a dynamic lever that dictates operational throughput and market agility. Reducing costs without compromising the integrity of the “Human Engine” requires a sophisticated understanding of unit labor costs, productivity variance, and the hidden frictions of administrative overhead.

    The complexity of managing labor expenditure has been amplified by the “Skills Gap” and the “Great Renegotiation,” where the power dynamic between employer and employee has reached a delicate stasis. Organizations are no longer operating in a surplus-labor environment. Consequently, the mandate for cost reduction must be balanced against the high cost of attrition and the long-term erosion of institutional knowledge. A shallow focus on hourly wages often ignores the more significant “Total Cost of Employment” (TCE), which includes the amortization of training, the burden of benefits, and the opportunity cost of low engagement.

    To navigate this terrain, one must move beyond the accounting ledger and into the realm of “Industrial Engineering” and “Organizational Psychology.” True efficiency is found at the intersection of process automation and human-centric design. It involves deconstructing every task into its constituent parts to identify “Value-Added” versus “Non-Value-Added” time. This article provides a rigorous, multi-dimensional interrogation of the mechanics of labor expenditure, offering a roadmap for sustainable optimization that prioritizes structural health over short-term financial optics.

    Understanding “how to reduce labor cost”

    The pursuit of how to reduce labor cost is frequently misinterpreted as a mandate for austerity. In a professional, editorial context, this objective is better defined as the “Optimization of Labor Yield.” A common misunderstanding among mid-level management is that reducing the headcount by 10% will result in a 10% reduction in costs. In reality, the “Second-Order Effects”—overtime for the remaining staff, a drop in quality control, and increased recruitment costs due to brand damage—often negate the initial savings.

    Oversimplification risks are particularly high when applying universal benchmarks to specific industries. What constitutes an efficient labor-to-revenue ratio in retail (where labor is a variable cost tied to foot traffic) is catastrophic in high-tech manufacturing (where labor is a fixed investment in specialized skills). To master how to reduce labor cost, an analyst must interrogate the “Friction points” within a workflow. Is the cost high because of the wage rate, or because the workforce is spending 40% of their time navigating fragmented software systems and manual data entry?

    Genuine mastery involves looking at “Labor Density.” This is the measure of how much high-value output is generated per hour of human intervention. By shifting the focus from “Cost per Hour” to “Cost per Unit of Outcome,” a business can identify where it is “Over-Laboring” a process. This might mean that a high-wage expert is actually cheaper than three low-wage novices if the expert produces zero defects and requires no supervision. This multi-perspective approach ensures that cost-cutting does not become “Self-Sabotage.”

    Deep Contextual Background: The Evolution of Labor Metrics

    How to reduce labor cost the history of labor management can be viewed as a transition from “Brawn” to “Brain” and eventually to “Binary.” In the early Industrial Revolution, labor was treated as a fungible commodity. The “Taylorism” of the early 20th century introduced scientific management, focusing on the “One Best Way” to perform physical tasks, effectively treating the human worker as a predictable mechanical component.

    In the post-war era, the rise of the “Knowledge Worker” shifted the metric toward “Output-based” management. However, this period also saw the ballooning of administrative “middle” layers—what some economists call “Bureaucratic Creep.” As organizations grew, the ratio of “Direct Labor” (those making the product) to “Indirect Labor” (those managing the paperwork) became skewed.

    We are currently in the era of “Algorithmic Efficiency.” The modern challenge is not just physical speed, but “Cognitive Load Management.” Labor costs today are driven by the complexity of the global supply chain and the necessity of constant upskilling. Reducing these costs in 2026 requires a “Levers and Pulley” approach: using technology to automate repetitive cognitive tasks so that the human workforce can focus on high-variance problem-solving. This evolution has made labor cost management a function of “Systems Design” rather than simple payroll negotiation.

    Conceptual Frameworks and Mental Models How To Reduce Labor Cost

    The “Waste Hierarchy” (DOWNTIME)

    Derived from Lean manufacturing, this model identifies eight types of waste that inflate labor costs: Defects, Overproduction, Waiting, Non-utilized talent, Transportation, Inventory, Motion, and Extra-processing. By applying this to office environments, managers find that the “Waiting” and “Extra-processing” (redundant meetings/emails) are the primary drivers of labor bloat.

    The “Unit Labor Cost” (ULC) Framework

    This mental model links wages to productivity. If wages rise by 5% but productivity rises by 10%, the “Unit Labor Cost” has actually decreased. This allows for a “High-Wage, Low-Cost” strategy that attracts top talent while maintaining a competitive edge.

    The “Core-Perimeter” Model

    This framework categorizes the workforce into “Core” (permanent, strategic talent) and “Perimeter” (contractors, automated systems, seasonal labor). Reducing costs involves keeping the Core small and highly efficient while using the Perimeter to absorb market volatility, ensuring the organization doesn’t over-hire during peak cycles.

    Key Categories of Optimization How To Reduce Labor Cost

    Optimization strategies are not monolithic; they require a triage based on the specific “Failure Mode” of the organization’s current labor model.

    Strategy Typology Primary Mechanism Trade-off Ideal Application
    Workflow Compression Eliminating redundant approvals Risk of reduced oversight High-growth tech, Creative agencies
    Skill-Task Alignment Moving low-skill tasks to lower-cost tiers Potential for “Siloing” expertise Legal, Medical, Financial Services
    Automation Substitution Replacing manual data entry with RPA High initial CapEx Logistics, Payroll, Manufacturing
    Flexible Scheduling Aligning labor hours to demand curves Lower employee predictability Hospitality, Retail, Healthcare

    Realistic Decision Logic

    When an organization asks how to reduce labor cost, the first decision is whether the problem is “Capacity” or “Efficiency.” If capacity is the issue (too many people for the work), the solution is structural. If efficiency is the issue (the right number of people doing the work poorly), the solution is process-oriented. Mixing these two—for instance, firing people to solve a process problem—results in a “Spiral of Incompetence.”

    Detailed Real-World Scenarios How To Reduce Labor Cost

    The “Meeting-Heavy” Engineering Team

    • The Constraint: A team of 50 software engineers spending 15 hours a week in non-technical meetings.

    • The Calculation: At an average burdened rate of $150/hr, the organization is “spending” $112,500 per week on talk.

    • The Intervention: Implementing “Async-First” communication and limiting meetings to 30 minutes with strict agendas.

    • Second-Order Effect: Reclaiming 10 hours per engineer per week is equivalent to “hiring” 12 new engineers for free.

    The “Over-Specified” Administrative Layer

    • The Constraint: A healthcare provider using Registered Nurses (RNs) to perform basic data entry and patient intake.

    • The Decision Point: Utilizing Medical Assistants (MAs) or automated kiosks for intake.

    • Analysis: By shifting 40% of the RN’s shift to MAs, the cost per patient visit drops significantly while RN job satisfaction (and retention) increases.

    Planning, Cost, and Resource Dynamics

    The “Cost of Optimization” often acts as a barrier to entry. Many firms continue with inefficient labor models because they lack the “Transition Capital” to change.

    Phase of Optimization Direct Cost Indirect Cost Opportunity Risk
    Diagnostic Audit $20k – $100k Management time Identifying the wrong “Lever”
    Software Implementation $50k – $500k Employee “Learning Curve” Integration failure with legacy systems
    Structural Realignment Severance/Hiring fees Loss of morale / Attrition “Brain Drain” of key experts

    Tools, Strategies, and Support Systems

    1. Robotic Process Automation (RPA): Tools that act as “Digital Labor,” handling repetitive keystrokes in accounting or HR.

    2. Cross-Training Matrices: Ensuring that “Person A” can do “Job B” during peak periods, reducing the need for temporary external labor.

    3. Variable Compensation Structures: Tying a portion of pay to “Productivity Milestones” rather than just hours clocked.

    4. Workforce Management (WFM) Software: Using AI to predict demand spikes and optimize shift patterns (essential in the “best smart cities united states” infrastructures).

    5. BPO (Business Process Outsourcing): Moving non-core functions (like Tier 1 customer support) to lower-cost geographical regions.

    6. “Self-Service” Architectures: Enabling customers or employees to handle their own data entry (e.g., automated portals).

    Risk Landscape and Failure Modes How To Reduce Labor Cost

    The most dangerous failure mode in labor cost reduction is “The Productivity Paradox.” This occurs when the tools or processes meant to save time actually create new, more complex work.

    • The “Shadow Work” Trap: When an admin is laid off, their work doesn’t disappear; it is distributed to higher-paid executives who are now spending $300/hr doing $25/hr work.

    • The Quality Death Spiral: Reducing labor in quality assurance leads to product returns, which require more customer service labor, creating a net loss.

    • Regulatory Friction: In states with rigid labor laws, shifting schedules too aggressively can lead to “Predictive Scheduling” penalties or class-action litigation regarding overtime misclassification.

    Governance, Maintenance, and Long-Term Adaptation

    A labor reduction strategy is not a “Set-and-Forget” exercise. It requires a “Governance Loop” to ensure that the organization doesn’t “Re-Bloat.”

    The “Efficiency Review” Checklist:

    • Monthly: Review the “Labor as % of Revenue” trend line.

    • Quarterly: Audit “Span of Control” (the number of direct reports per manager). If a manager has only 2-3 reports, the layer is likely redundant.

    • Annually: Perform a “Task-to-Value” mapping to ensure that new technologies haven’t rendered current roles obsolete.

    • Trigger Event: Any time a department requests a “New Headcount,” they must first demonstrate that they have optimized their current “Wait Time” and “Redundancy” metrics.

    Measurement, Tracking, and Evaluation How To Reduce Labor Cost

    • Leading Indicators: “Employee Utilization Rate” (the percentage of hours spent on billable/productive work); “Average Time to Completion” for standard tasks.

    • Lagging Indicators: “EBITDA per Employee”; “Voluntary Turnover Rate”; “Total Labor Burden per Unit of Output.”

    • Documentation Examples:

      1. The “Labor Dashboard”: A live view of labor spend vs. budget by department.

      2. Productivity Heatmaps: Identifying specific shifts or teams that are consistently “Under-Yielding.”

    Common Misconceptions and Oversimplifications

    • Myth: “Low wages always equal low labor cost.” Correction: High-wage labor is often more “Cost-Effective” due to lower error rates and higher self-management capabilities.

    • Myth: “Remote work reduces labor costs.” Correction: It reduces real estate costs, but can increase labor costs through “Communication Drag” if not managed with rigorous async protocols.

    • Myth: “Overtime is always bad.” Correction: Occasional overtime is often cheaper than hiring a new full-time employee with a full benefits package.

    • Myth: “AI will replace all labor.” Correction: AI is a “Force Multiplier” that replaces tasks, not roles. The goal is “Augmentation,” not total replacement.

    Ethical and Practical Considerations How To Reduce Labor Cost

    The “Invisible Cost” of labor optimization is the social contract. An organization that optimizes its labor costs by creating a “High-Stress, Low-Security” environment will eventually pay a “Loyalty Tax.” This manifests as high recruitment costs and a lack of innovation. Sustainable labor reduction must be “Transparent.” Employees who understand that efficiency gains protect the firm’s long-term viability—and perhaps lead to “Profit Sharing”—are more likely to participate in the process rather than resist it.

    Conclusion

    Mastering how to reduce labor cost is an ongoing negotiation between “Mechanical Efficiency” and “Human Potential.” The most successful organizations do not view their workforce as a cost to be minimized, but as a system to be refined. By applying rigorous conceptual frameworks, investing in high-yield tools, and maintaining a vigilant governance structure, a business can achieve a lean, agile posture that is resilient to economic volatility. The ultimate objective is a workforce that is not just “Cheaper,” but significantly more “Impactful.”

  • The Friction of Execution: Navigating the Complexities of Construction Management

    The Friction of Execution: Navigating the Complexities of Construction Management

    How to manage contractor problems the delivery of a complex construction project is rarely a linear progression from architectural intent to physical reality. It is, instead, a high-stakes exercise in risk management and human psychology. In a professional landscape characterized by labor shortages, volatile material costs, and increasingly intricate building codes, the relationship between a client and a general contractor often operates under significant structural tension. This tension is not inherently negative; when channeled correctly, it ensures accountability and precision. However, when left unmanaged, it manifests as delays, budgetary creep, and litigation.

    The modern construction environment has evolved far beyond the “handshake agreement” era. Today, the execution of a project involves a sophisticated web of sub-contractors, specialized engineers, and supply chain logistics. Consequently, a problem on-site is rarely the result of a single person’s incompetence. It is usually the failure of a system—a breakdown in communication protocols, an oversight in the procurement schedule, or a misunderstanding of the “Scope of Work” (SOW). To view contractor issues as mere personality conflicts is a fundamental error that leads to reactive, rather than proactive, management.

    True expertise in this field lies in the ability to identify “early-warning signals” before a project reaches a state of crisis. This requires an analytical mindset that prioritizes documentation over emotion and contractual clarity over verbal assurances. It involves understanding the industrial pressures that contractors face—such as the “Trade Sequencing” crunch or the “Lien” laws that govern their financial safety. By adopting a systemic perspective, a project owner transforms from a frustrated observer into a strategic manager of resources.

    Understanding “how to manage contractor problems”

    To master how to manage contractor problems, one must first decouple the “symptom” from the “systemic cause.” A symptom might be a crew not showing up on a Tuesday morning; the systemic cause, however, is often a cash-flow delay from a previous project or a failure in the contractor’s labor-scheduling software. Many project owners attempt to solve these issues through escalation—anger or threats—which frequently results in a “work-to-rule” mentality where the contractor does the bare minimum to avoid legal breach but ceases to offer the proactive problem-solving essential for high-end builds.

    Common misunderstandings center on the belief that a strong contract is a substitute for active management. While a contract provides the legal floor, it does not provide the operational ceiling. Oversimplification risks occur when owners assume that withholding payment is the primary lever for control. In reality, withholding payment is often a “nuclear option” that can trigger a mechanics’ lien or cause the contractor to prioritize other, paying clients, thereby exacerbating the delay.

    A professional approach to this challenge involves “Symmetrical Information.” This means ensuring that both the owner and the contractor have the same understanding of the “Critical Path”—the sequence of stages that determines the project’s completion date. When you understand the logic behind the construction sequence, you can ask targeted questions that force the contractor to confront logistical gaps without resorting to confrontation. This intellectual shift from “policing” to “steering” is the hallmark of effective project governance.

    Contextual Evolution: The Shifting Balance of Power

    How to manage contractor problems the methodology of construction oversight has undergone a radical transformation. In the mid-20th century, the “Design-Bid-Build” model was the absolute standard. Owners held significant leverage because trades were plentiful and material costs were predictable. Problems were managed through a rigid hierarchy.

    However, the 21st century has introduced “Hyper-Complexity.” Modern homes and buildings now integrate smart-home automation, advanced HVAC systems, and sustainable materials that require specialized certification. This has shifted the balance of power toward the contractor, who acts as the gatekeeper to specialized labor. Furthermore, the “Gig Economy” has infiltrated the trades; a general contractor may no longer have a permanent crew, instead relying on a rotating cast of 1099 freelancers. This “Fragmentation of Responsibility” is the root of most modern project friction, making the management of problems a task of “Integrative Oversight” rather than traditional command-and-control.

    Conceptual Frameworks and Mental Models How To Manage Contractor Problems

    The “Incentive Alignment” Framework

    This model posits that most contractor problems arise because the owner’s goal (maximum quality at fixed cost) and the contractor’s goal (maximum margin through speed) are naturally at odds. Management, therefore, is the process of creating “Intermediate Milestones” that reward the contractor for quality and transparency, rather than just the final handover.

    The “Complexity-Certainty” Matrix

    This framework helps owners categorize problems based on their nature. A “Simple” problem (wrong paint color) requires immediate correction. A “Complex” problem (foundation drainage issues) requires a pause and a third-party engineering review. The failure to distinguish between these leads to “Patchwork Solutions” that fail later in the asset’s lifecycle.

    The “Critical Path” Transparency Model

    Project management should never be a “Black Box.” This model dictates that the contractor must provide a “Look-Ahead” schedule every two weeks. This forces the contractor to plan for the “Next Step” resources (e.g., ordering tiles six weeks before they are needed), which prevents the “Dead-Week” syndrome where no one is on-site because materials haven’t arrived.

    Key Categories of Contractor Issues

    Navigating the execution phase requires a taxonomy of potential failures. Understanding the trade-offs in how these are handled is vital.

    Issue Category Primary Driver Trade-off of Aggressive Action Resolution Strategy
    Communication Decay Over-reliance on verbal cues Can lead to “Ghosting” if handled poorly Mandate Weekly Written Status Reports
    Quality Divergence Speed-over-standard mindset Rework costs vs. project delays “Hold-Point” Inspections before closing walls
    Financial Instability “Robbing Peter to pay Paul” Risk of abandonment vs. Lien risk Direct-to-Sub payments or Joint Checks
    Scope Creep Unclear initial specifications Higher costs vs. functional regret Formal Change Order (CO) Protocol

    Realistic Decision Logic

    When a problem occurs, the logic should be: Is this a Breach of Contract or a Breakdown of Process? If it is a process breakdown, the solution is a “Corrective Action Plan” (CAP). If it is a breach, the solution involves formal “Notice to Cure.” Jumping to a Notice to Cure for a process breakdown often kills the working relationship prematurely.

    Detailed Real-World Scenarios How To Manage Contractor Problems

    The “Ghosting” Sub-Contractor

    • The Constraint: The General Contractor (GC) claims the plumber isn’t answering calls, stalling the entire bathroom build-out.

    • The Decision Point: Should the owner contact the plumber directly?

    • Analysis: No. Contacting subs directly undermines the GC’s authority and can create legal confusion over who is “Directing the Work.”

    • Resolution: Request the GC’s “Sub-Contractor Agreement.” If the GC doesn’t have a backup plumber or a liquidated damages clause for their subs, the problem is a “Management Deficit” on the part of the GC, not just a “Missing Plumber.”

    The “Hidden Defect”

    • The Constraint: After drywall is installed, a leak is detected, but the source is behind the finish.

    • The Second-Order Effect: Opening the wall delays the painter and the cabinet installer.

    • Action: Conduct a “Forensic Deconstruction.” If the error was the contractor’s, they absorb the cost of repair and the “re-drywalling.” If it was a design flaw, the owner pays. Establishing this “Fault-Logic” early prevents weeks of finger-pointing.

    Planning, Cost, and Resource Dynamics

    The “Cost of Friction” is often higher than the cost of the repair itself. Delays have a compounding effect on financing (interest carry) and opportunity costs (delayed move-in or rental income).

    Expense Type Range (as % of Budget) Impact of Mismanagement
    Contingency Fund 10% – 20% Exhausted early due to “unforeseen” errors
    Supervision Costs 3% – 5% Hidden costs if the owner must “babysit” the GC
    Rework/Correction 2% – 8% Direct loss of material and labor hours
    Legal/Consultation 1% – 5% High variability based on escalation speed

    Tools, Strategies, and Support Systems How To Manage Contractor Problems

    1. Project Management Software (Procore/CoConstruct): Centralizing all photos, daily logs, and change orders in one cloud-based source of truth.

    2. Lien Waivers: Never issue a progress payment without a signed lien waiver from both the GC and all major sub-contractors for the previous phase.

    3. Third-Party Owner’s Rep: In ultra-long or luxury builds, hiring a professional advocate to manage the contractor’s schedule daily.

    4. Schedule of Values (SOV): A detailed breakdown of every dollar in the contract, tied to specific physical progress, preventing “Front-Loading” where the contractor gets 80% of the money for 50% of the work.

    5. Punch-List Management: Using a “Rolling Punch-List” rather than waiting for the end of the project to find defects.

    6. Video Documentation: Recording “behind-the-wall” plumbing and electrical before insulation to ensure future problems can be diagnosed without demolition.

    Risk Landscape and Failure Modes

    The most dangerous failure mode is “The Sunk Cost Trap.” This occurs when an owner continues to pay a failing contractor because they have already spent $100,000 and fear that firing them will cause a total loss.

    • Compounding Risks: A delay in the roof leads to moisture in the framing, which leads to mold, which leads to an air-quality failure three months after the project “finishes.”

    • Taxonomy of Failure:

      • Operational: Schedule slippage.

      • Fiduciary: Misuse of funds/Liens.

      • Structural: Non-compliance with building codes.

    Governance, Maintenance, and Long-Term Adaptation How To Manage Contractor Problems

    Governance is the “Rhythm” of the project. If the rhythm is broken, problems multiply.

    The “Integrity Checklist”:

    • Weekly Site Meetings: Mandatory, with minutes recorded and distributed within 24 hours.

    • The “Clean-Site” Rule: A messy site is a leading indicator of sloppy work. Enforcing site cleanliness is a tool for managing mental discipline.

    • Adjustment Triggers: If a milestone is missed by more than 7 days, a “Recovery Schedule” must be submitted by the contractor before the next payment is released.

    Measurement, Tracking, and Evaluation

    • Leading Indicators: The ratio of “Open Issues” to “Resolved Issues” in the weekly log; the frequency of the GC’s presence on-site.

    • Lagging Indicators: Total Change Order percentage at the end of the project; “Days Beyond Original Completion.”

    • Documentation Examples:

      • The Daily Log: A simple record of weather, headcount, and work performed.

      • The Variance Report: Comparing the actual cost of a phase to the budgeted cost in real-time.

    Common Misconceptions and Oversimplifications How To Manage Contractor Problems

    • Myth: “I’ll just hire my own subs to save money.” Correction: Unless you are a licensed professional, you cannot manage the “Sequencing” or “Liability” of multiple trades. You become the GC, and you inherit all the problems.

    • Myth: “The architect will manage the contractor.” Correction: Unless you pay for “Construction Administration” (CA), the architect’s job ends at the drawing board.

    • Myth: “A fixed-price contract protects me from all cost increases.” Correction: “Unforeseen Conditions” and “Owner Changes” can still trigger massive costs even in fixed-price models.

    • Myth: “Contractors always try to cheat.” Correction: Most problems are the result of poor estimation and “Optimism Bias”—contractors genuinely believe they can finish faster than they can.

    Conclusion

    Mastering how to manage contractor problems is ultimately an exercise in “Professional Detachment.” It requires the owner to step back from the emotional weight of their project and view the construction site as a production environment that requires constant calibration. The goal is not to eliminate all problems—which is an impossibility in a field as volatile as construction—but to build a framework where problems are identified early, documented clearly, and resolved through a pre-negotiated logic. A project that finishes with a few managed hurdles is far more successful than one that finishes “perfectly” but leaves the participants in a state of financial and emotional exhaustion.

  • You are a senior human editorial writer producing ultra-long, deeply researched informational content intended for long-term organic visibility and topical authority. TASK: Write an ultra-long, in-depth, SEO-clean informational article about: “luxury coastal homes usa”. CONTENT GOAL: Produce a flagship “pillar” article that demonstrates deep topical mastery, feels written by an experienced human editor, serves as a definitive reference (not a summary), is resilient to AI-detection and algorithmic scrutiny, and can stand alone as a long-term authority asset. TARGET LENGTH: Ultra-long depth equivalent to 6,000–10,000+ words, expanded through reasoning, nuance, layered explanation, and examples—never padding with fluff, repetition, or filler paragraphs. TARGET AUDIENCE: Readers who expect serious depth, contextual understanding, and practical clarity beyond surface-level explanations. LANGUAGE & TONE: American English; calm, editorial, analytical; professional but approachable; confident without sounding absolute; no hype, no persuasion, no marketing tone; no personal anecdotes or first-person storytelling. ANTI-AI FINGERPRINT RULES (CRITICAL): Aggressively vary sentence rhythm; avoid repeating paragraph shapes; do not explain obvious concepts unless contextually necessary; allow asymmetry across sections; avoid formulaic transitions; use natural editorial flow; write as if revising a serious editorial draft. KEYWORD RULES: Use the exact phrase “luxury coastal homes usa” naturally 6–10 times across the article; include it EXACTLY ONCE as an H2 heading; never force the keyword; rely on semantic variants elsewhere. STRUCTURE: (1) Introduction (3–4 paragraphs establishing scope and complexity, no generic SEO openings). (2) Table of Contents (major sections only). (3) H2: Understanding “luxury coastal homes usa” (multi-perspective explanation, common misunderstandings, oversimplification risks). (4) Deep Contextual Background (historical/systemic evolution). (5) Conceptual Frameworks and Mental Models (3–5 frameworks with limits). (6) Key Categories or Variations (6–8 categories with trade-offs, one comparison table, followed by realistic decision logic). (7) Detailed Real-World Scenarios (4–6 scenarios with constraints, decision points, failure modes, second-order effects). (8) Planning, Cost, and Resource Dynamics (direct/indirect costs, opportunity cost, variability; one range-based table). (9) Tools, Strategies, and Support Systems (6–8 items with limits). (10) Risk Landscape and Failure Modes (taxonomy and compounding risks). (11) Governance, Maintenance, and Long-Term Adaptation (monitoring, review cycles, adjustment triggers, layered checklist). (12) Measurement, Tracking, and Evaluation (leading vs lagging indicators, qualitative vs quantitative signals, 3–4 documentation examples). (13) Common Misconceptions and Oversimplifications (6–8 myths with corrections). (14) Ethical, Practical, or Contextual Considerations (if relevant). (15) Conclusion (synthesis, judgment, adaptability; no CTA). FORMATTING RULES: Use clear H2/H3 headings; vary paragraph length; tables/bullets only when they add clarity; no external links or citations; no emojis; do not reference AI or content generation. FINAL INSTRUCTION: Write with patience, editorial judgment, and intellectual honesty—depth, nuance, and coherence over symmetry or speed, and also details for fill in the YOAST SEO

    You are a senior human editorial writer producing ultra-long, deeply researched informational content intended for long-term organic visibility and topical authority. TASK: Write an ultra-long, in-depth, SEO-clean informational article about: “luxury coastal homes usa”. CONTENT GOAL: Produce a flagship “pillar” article that demonstrates deep topical mastery, feels written by an experienced human editor, serves as a definitive reference (not a summary), is resilient to AI-detection and algorithmic scrutiny, and can stand alone as a long-term authority asset. TARGET LENGTH: Ultra-long depth equivalent to 6,000–10,000+ words, expanded through reasoning, nuance, layered explanation, and examples—never padding with fluff, repetition, or filler paragraphs. TARGET AUDIENCE: Readers who expect serious depth, contextual understanding, and practical clarity beyond surface-level explanations. LANGUAGE & TONE: American English; calm, editorial, analytical; professional but approachable; confident without sounding absolute; no hype, no persuasion, no marketing tone; no personal anecdotes or first-person storytelling. ANTI-AI FINGERPRINT RULES (CRITICAL): Aggressively vary sentence rhythm; avoid repeating paragraph shapes; do not explain obvious concepts unless contextually necessary; allow asymmetry across sections; avoid formulaic transitions; use natural editorial flow; write as if revising a serious editorial draft. KEYWORD RULES: Use the exact phrase “luxury coastal homes usa” naturally 6–10 times across the article; include it EXACTLY ONCE as an H2 heading; never force the keyword; rely on semantic variants elsewhere. STRUCTURE: (1) Introduction (3–4 paragraphs establishing scope and complexity, no generic SEO openings). (2) Table of Contents (major sections only). (3) H2: Understanding “luxury coastal homes usa” (multi-perspective explanation, common misunderstandings, oversimplification risks). (4) Deep Contextual Background (historical/systemic evolution). (5) Conceptual Frameworks and Mental Models (3–5 frameworks with limits). (6) Key Categories or Variations (6–8 categories with trade-offs, one comparison table, followed by realistic decision logic). (7) Detailed Real-World Scenarios (4–6 scenarios with constraints, decision points, failure modes, second-order effects). (8) Planning, Cost, and Resource Dynamics (direct/indirect costs, opportunity cost, variability; one range-based table). (9) Tools, Strategies, and Support Systems (6–8 items with limits). (10) Risk Landscape and Failure Modes (taxonomy and compounding risks). (11) Governance, Maintenance, and Long-Term Adaptation (monitoring, review cycles, adjustment triggers, layered checklist). (12) Measurement, Tracking, and Evaluation (leading vs lagging indicators, qualitative vs quantitative signals, 3–4 documentation examples). (13) Common Misconceptions and Oversimplifications (6–8 myths with corrections). (14) Ethical, Practical, or Contextual Considerations (if relevant). (15) Conclusion (synthesis, judgment, adaptability; no CTA). FORMATTING RULES: Use clear H2/H3 headings; vary paragraph length; tables/bullets only when they add clarity; no external links or citations; no emojis; do not reference AI or content generation. FINAL INSTRUCTION: Write with patience, editorial judgment, and intellectual honesty—depth, nuance, and coherence over symmetry or speed, and also details for fill in the YOAST SEO

    Luxury coastal homes usa the American shoreline represents more than a geographical boundary; it is a complex intersection of high-value capital, specialized engineering, and increasingly volatile ecological dynamics. To discuss the upper echelon of residential waterfront property is to analyze a sector where the traditional metrics of real estate—square footage and aesthetic finishes—are secondary to the sophisticated management of environmental exposure.

    Current trends in high-end coastal development reflect a fundamental pivot from “vulnerability” to “calculated resilience.” The modern owner of a premium seaside estate is no longer satisfied with mere aesthetic beauty. There is an intellectual shift toward understanding the “Hydro-Morphology” of a site: how the sea moves, how the sand migrates, and how the salt-laden atmosphere interacts with the chemistry of construction materials. This shift has birthed a new class of “Active Architecture,” buildings that do not just sit on the land but interact with it through sophisticated drainage systems, hurricane-rated glazing, and adaptive foundations.

    In the 2026 market, the discourse surrounding coastal living has matured. It has moved past the era of “conquering the coast” toward a more nuanced philosophy of “Integration.” This involves a collision of disciplines—structural engineering, marine biology, and climate modeling—all distilled into a single residential footprint. This article provides a rigorous, editorial interrogation of the factors that define the most significant shoreline residences in the country, moving beyond surface-level luxury to examine the systemic realities of these complex assets.

    Understanding “luxury coastal homes usa”

    To accurately define luxury coastal homes usa, one must look past the gloss of architectural photography. In a professional capacity, this term describes a specific category of “High-Performance Real Estate” that occupies the delicate transition zone between marine and terrestrial ecosystems. A common misunderstanding among buyers is the belief that “luxury” equates to “invincibility.” In reality, the most expensive homes are often the most exposed, requiring a level of mechanical and structural stewardship that far exceeds inland properties.

    Oversimplification risks are rampant in this sector. Marketing materials often focus on “unobstructed views,” yet from an editorial and engineering perspective, an unobstructed view is often a “high-velocity wind path.” The true “luxury” in luxury coastal homes usa today is the luxury of security—the peace of mind that comes from knowing a home can withstand a 500-year storm event without losing its structural or digital integrity.

    Furthermore, we must distinguish between “Access” and “Ownership.” Owning a coastal asset in the U.S. means entering into a lifelong negotiation with state coastal commissions, local zoning boards, and insurance underwriters. It is a multi-dimensional commitment where the “Product” is not just the house, but the ongoing ability to maintain the viability of the land it sits upon. Identifying the top tier of these homes requires an analytical lens that values “The Invisible Build”—the pilings, the vapor barriers, and the corrosion-resistant alloys that keep the property functional.

    Contextual Evolution: From Vernacular Cottages to Fortified Estates

    Luxury coastal homes usa the trajectory of the American waterfront home has transitioned through three distinct phases. Historically, coastal builds were “Sacrificial.” They were light, wood-framed structures designed to let the wind pass through, utilizing deep porches for natural ventilation before the advent of climate control.

    The mid-century “Boom” introduced a more aggressive stance. With the rise of the Interstate Highway System and advancements in concrete technology, developers began to build “Immovable Objects.” This era saw the rise of massive seawalls and the filling of wetlands to create more “buildable” lots. The goal was to dominate the landscape, treating the ocean as a static backdrop rather than a dynamic force.

    We have now entered the era of “The Adaptive Fortress.” Today’s premier coastal builds recognize that the ocean is rising and storms are intensifying. This historical pivot has led to the adoption of “Commercial-Grade” residential construction.

    Conceptual Frameworks and Mental Models Luxury Coastal Homes Usa

    The “Passive-First” Resilience Model

    This framework prioritizes mechanical-free survivability.

    The “Envelope Integrity” Framework

    In coastal engineering, the “Envelope” (the roof, windows, and doors) is the primary line of defense. This model posits that a single breach in the envelope during a storm causes an internal pressure spike that can literally lift a roof off from the inside.

    The “Ecosystem Services” Mental Model

    This model views the property not as a separate entity, but as part of a coastal “Buffer.” It argues that a home’s long-term value is tied to the health of the surrounding dunes or mangroves. Armoring a property with a seawall may protect it in the short term, but it often destroys the beach in front of it, eventually undermining the property’s market appeal.

    Typologies of Coastal Living Luxury Coastal Homes Usa

    The geographical diversity of the U.S. coastline necessitates vastly different construction philosophies. What works in the rocky cliffs of Big Sur is a recipe for failure on the shifting sands of the Hamptons.

    Region Primary Challenge Structural Response Architectural Signature
    Pacific Northwest High moisture & Seismic risk Steel-reinforced masonry & deep overhangs Modernist timber & glass
    South Florida Hurricane surge & Humidity Concrete pilings & “Blow-out” ground floors Neo-Mediterranean or Tropical Modern
    Northeast / New England Nor’easters & Salt-air rot Cedar shingles & advanced vapor barriers Classic Shingle Style / Cape Cod
    Gulf Coast Massive storm surges Timber-piling elevation (15ft+) Raised pavilions with wrap-around decks

    Realistic Decision Logic

    Choosing a site for luxury coastal homes usa involves a “Risk-Aversion Matrix.” A buyer must decide between “Proximity” and “Protection.” A home built on the primary dune offers the most visceral connection to the sea but carries the highest insurance premiums and the shortest projected lifespan. Conversely, building on the “Second Tier” (behind a protective ridge) offers a logarithmic increase in security at the cost of the direct “toes-in-sand” experience.

    Detailed Real-World Scenarios Luxury Coastal Homes Usa

    The “Sacrificial” First Floor

    • The Constraint: A zoning requirement in a high-surge zone (V-Zone) that prohibits finished living space below a certain elevation.

    • The Strategy: Designing a “Grand Entry” that uses flood-vented garage space and high-end materials like marine-grade stone that can be hosed down after a surge.

    • Failure Mode: Installing sensitive electrical panels or elevator pits in these lower levels, leading to a total building shutdown after a minor flood.

    The “Salt-Mist” Enclosure

    • The Constraint: A property within 500 feet of the mean high-tide line faces constant “Chloride Attack” on all metal surfaces.

    • The Decision Point: Utilizing standard aluminum window frames versus 316-grade stainless steel or copper-clad units.

    • Second-Order Effect: Choosing the lower-cost aluminum results in “Pitting” and operational failure of window hardware within five years, requiring a disruptive and expensive full-house window replacement.

    Planning, Cost, and Resource Dynamics

    The “Coastal Premium” is not just in the land cost; it is in the “Hidden Hard Costs” of specialized labor and materials. A coastal build typically costs 40% to 100% more per square foot than an equivalent inland build.

    Expense Category Typical “Coastal” Premium Rationale
    Fenestration (Windows/Doors) 200% – 400% Impact-rating and salt-resistant hardware
    Foundation / Piling $50k – $250k+ Helical piles or deep-driven concrete piers
    HVAC Systems 50% – 100% Specialized coatings to prevent coil corrosion
    Insurance Premiums 300% – 800% Windstorm and Flood “excess” coverage

    Structural Support Systems and Specialized Technologies Luxury Coastal Homes Usa

    1. Helical Piles: Screw-like steel foundations that reach stable soil or bedrock without the vibration of traditional pile driving, protecting neighboring sensitive structures.

    2. Sacrificial Anodes: Utilizing metal plates that corrode instead of the home’s primary structural steel, common in extreme marine environments.

    3. High-Performance Glazing: Glass that can withstand a strike from a 9-pound 2×4 moving at 34 mph, a standard requirement for many luxury coastal homes usa.

    4. Marine-Grade 316 Stainless Steel: The industry standard for any exterior fastener or railing to prevent “tea-staining” and structural rust.

    5. Micro-Grid / BESS Integration: Since coastal storms often take out regional power for weeks, top-tier homes now feature Battery Energy Storage Systems coupled with solar or gas generators.

    6. Hydrostatic Vents: Specialized openings in foundation walls that allow water to flow through the house during a surge, preventing the pressure from collapsing the walls.

    Risk Landscape and Failure Modes

    The primary risk in this asset class is “Component Chain Failure.” If the roof fails, the interior is lost. If the windows fail, the roof is lost.

    • Corrosion Fatigue: The silent failure of internal metal connectors (hurricane straps) that are hidden behind drywall. If salt air penetrates the wall cavity, the home’s “Skeleton” can weaken without any visible signs on the exterior.

    • Erosion Setback Risk: The “Moving Target” of the shoreline. A home that was built 100 feet from the water may find itself 20 feet from the water after a single catastrophic hurricane season.

    • Insurance Insolvency: The risk that the cost of carrying the asset becomes “Unmarketable” because private insurers exit the state, leaving owners dependent on high-cost, low-coverage state-backed pools.

    Governance, Maintenance, and Long-Term Adaptation Luxury Coastal Homes Usa

    A coastal home is never truly “finished.” It is in a constant state of repair against the elements. Maintenance here is not cosmetic; it is “Asset Preservation.”

    The “Coastal Governance” Checklist:

    • Quarterly: Wash-down of all exterior surfaces (windows, railings, sidings) with fresh water to remove salt crystals.

    • Bi-Annually: Inspection of window seals and weatherstripping for “Salt Calcification” which causes air leaks.

    • Annually: Testing of all flood vents and inspection of the “First Floor” structural connections for signs of spalling concrete or rusted rebar.

    • Decadal: Full assessment of the shoreline protection (dunes/seawalls) and potential “Retrofitted Elevation” if local flood maps have shifted.

    Measurement and Evaluation: Leading vs. Lagging Indicators

    • Leading Indicators: The “Relative Humidity” in wall cavities (measured via smart sensors); “Chloride Penetration Depth” in concrete pilings. These predict future structural failure.

    • Lagging Indicators: The “Cost of Insurance” as a percentage of property value; the “Recovery Time” (how many days until a home is habitable after a Category 3 storm).

    • Documentation: The “Structural Maintenance Log,” which acts as a “Service Record” for the house, significantly increasing resale value by proving the integrity of the hidden systems.

    Common Misconceptions and Oversimplifications Luxury Coastal Homes Usa

    • Myth: “Concrete homes are waterproof.” Correction: Concrete is a porous material. Without proper specialized membranes, salt water can reach the internal steel rebar, causing it to rust, expand, and “Spall” (crack) the concrete from within.

    • Myth: “Hurricane shutters are old-fashioned.” Correction: Even with impact-glass, shutters provide a secondary layer of protection against debris and prevent “Glass Pitting” from wind-blown sand.

    • Myth: “Building on stilts is enough.” Correction: Elevation protects from water, but it increases the “Wind Load” on the structure. A raised house acts like a sail, requiring massive internal shear walls to prevent swaying or collapse.

    • Myth: “The seawall will protect the house forever.” Correction: Seawalls often accelerate the erosion of the sand at their base, eventually leading to a “Toe Failure” where the entire wall collapses into the ocean.

    Conclusion

    The pursuit of luxury coastal homes usa is an exercise in managing the inevitable. While the allure of the American waterfront remains undiminished, the definition of success in this market has shifted toward “Intelligent Stewardship.” The most valuable properties are no longer those that shout the loudest architecturally, but those that whisper their resilience through superior engineering and meticulous maintenance. In an era of rising tides and climatic unpredictability, the ultimate luxury is a home that respects the power of the sea while providing a sanctuary that is structurally and operationally prepared for the long horizon.