Category: Strategic Project Oversight

  • The Sovereign Circuit: Orchestrating Equilibrium in Decentralized Power

    The Sovereign Circuit: Orchestrating Equilibrium in Decentralized Power

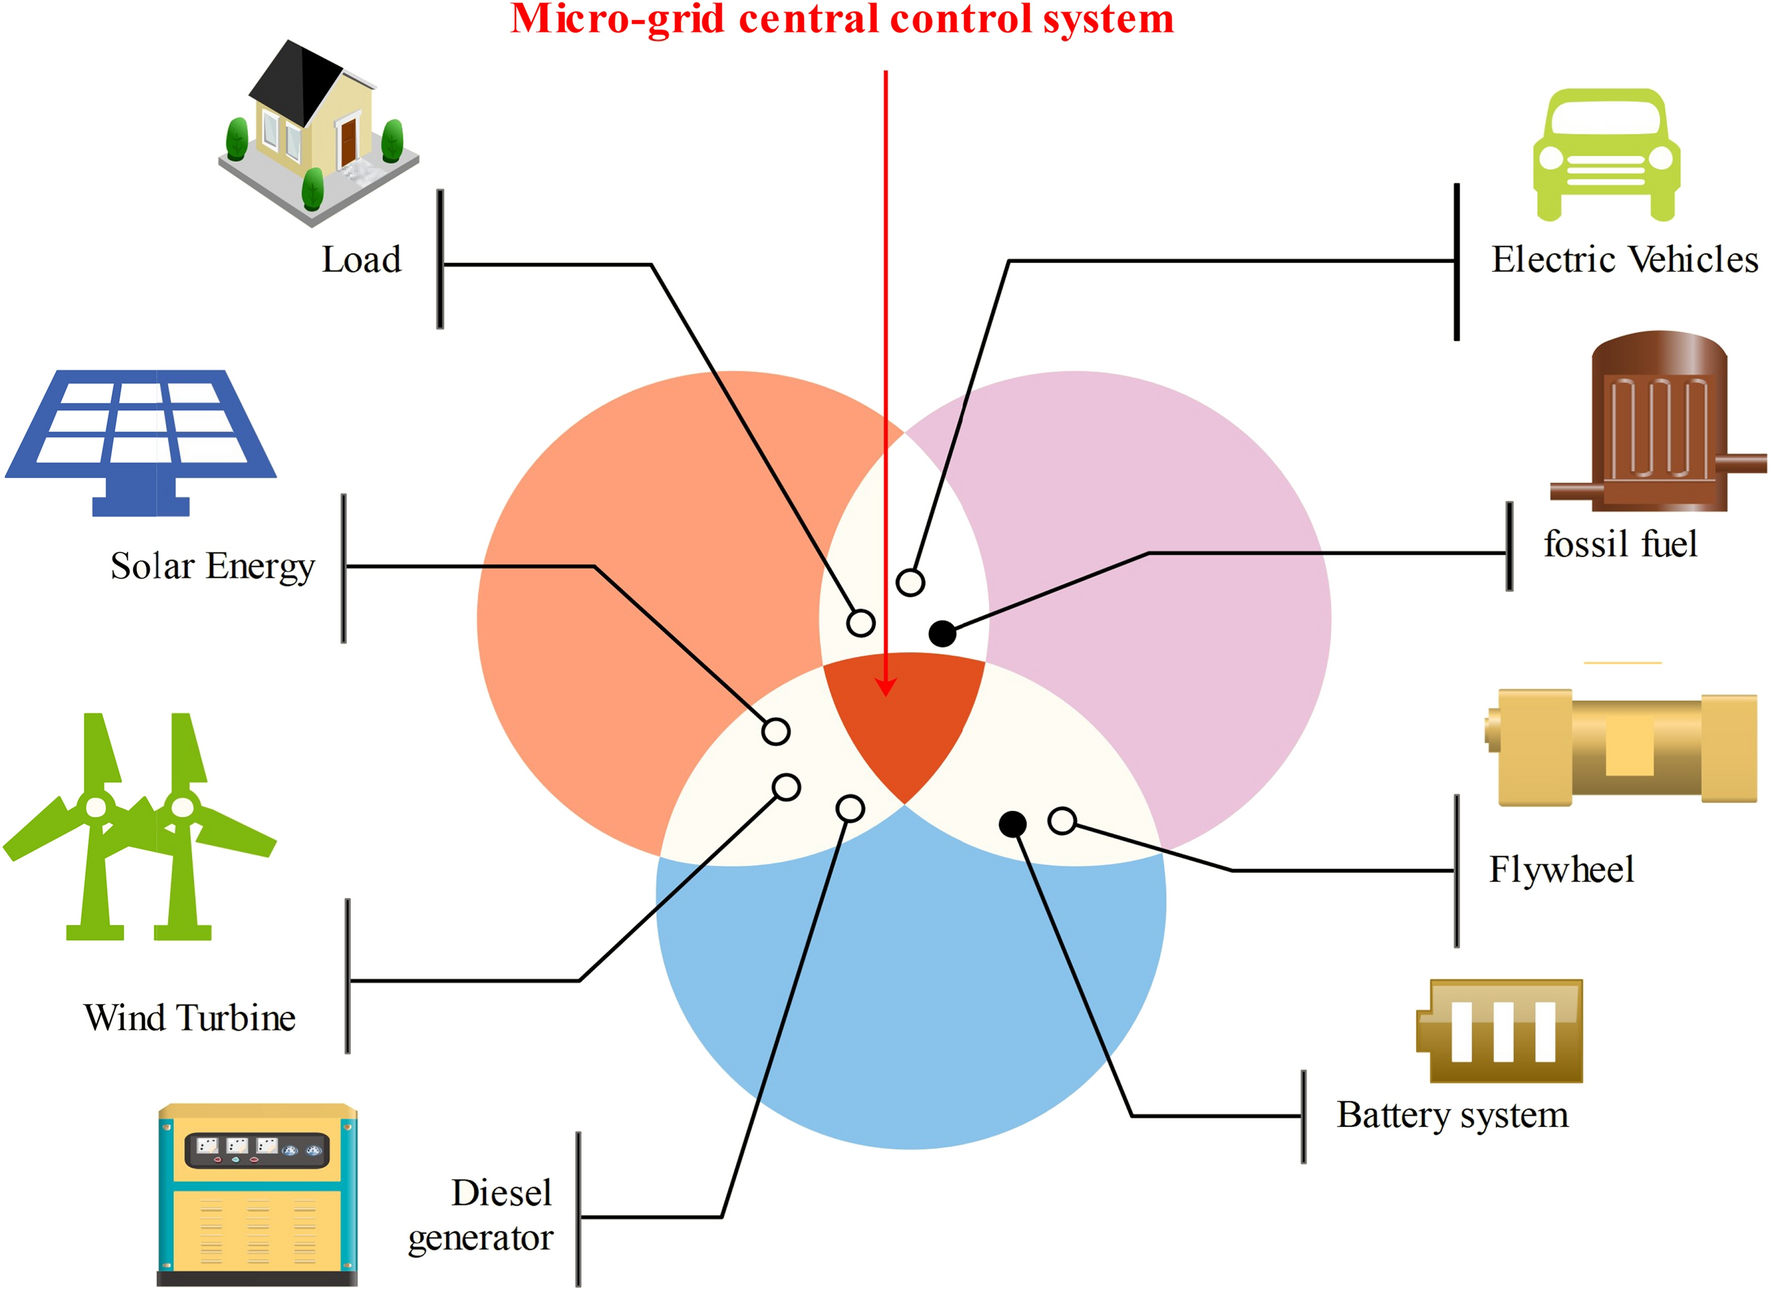
    On-site microgrid stabilization the transition from a centralized “Hub-and-Spoke” utility model to a distributed energy landscape has introduced a profound technical paradox: while localized generation increases resilience, it simultaneously degrades the inherent stability provided by the massive inertia of the national grid. Traditional power systems rely on the sheer rotational momentum of giant turbines to “ride through” minor disturbances. In contrast, a microgrid—comprising solar photovoltaics, wind turbines, and battery storage—is an inverter-based ecosystem that lacks this mechanical cushion. Achieving equilibrium in such an environment requires a sophisticated layer of digital and electrical orchestration.

    The volatility of renewable sources, coupled with the “Step-Load” demands of modern industrial equipment, creates a high-stakes environment where voltage and frequency can fluctuate violently within milliseconds. Without a rigorous strategy for stabilization, a microgrid risks “Nuisance Tripping,” equipment damage, or total system collapse during the critical transition from grid-connected to “Islanded” mode. The challenge is not merely to generate power, but to maintain the “Power Quality” necessary for sensitive digital infrastructure and precision manufacturing.

    True energy independence is therefore not a matter of hardware accumulation, but of control logic. To manage an on-site energy system is to engage in a continuous, high-speed negotiation between supply, demand, and storage. This article interrogates the structural and algorithmic requirements of localized grid management, moving beyond the surface-level discussion of “Backup Power” to examine the deep engineering required for a self-sustaining, balanced electrical sovereign.

    Understanding “On-Site Microgrid Stabilization”
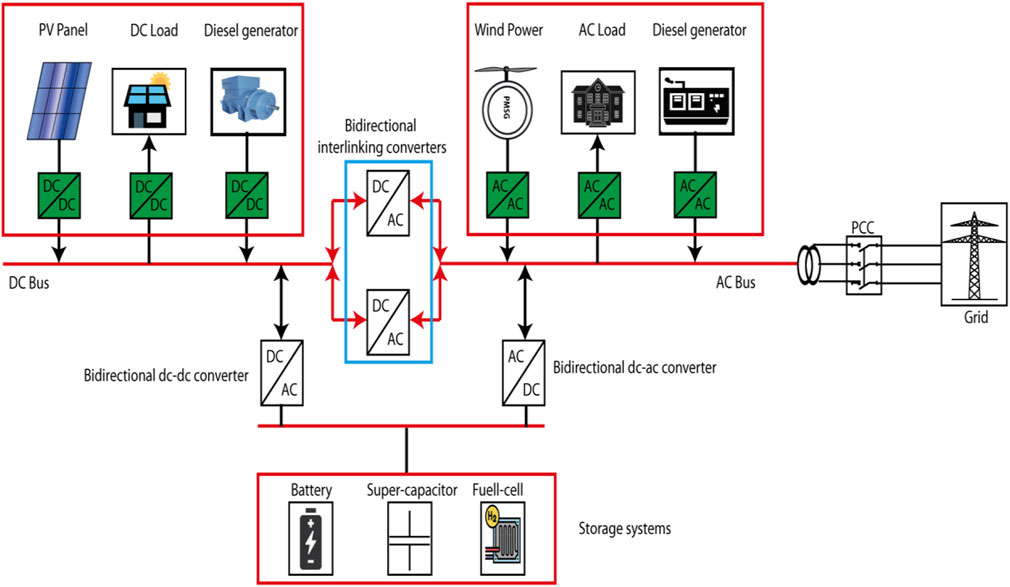
    To define On-Site Microgrid Stabilization is to describe the active management of frequency and voltage within a localized power system to ensure it remains within operational tolerances. A common misunderstanding among facility managers is the belief that a Battery Energy Storage System (BESS) acts as a universal stabilizer by default. In reality, a BESS is only as effective as its “Inverter Control Strategy.” If the inverter is “Grid-Following,” it will shut down the moment the main utility fails; if it is “Grid-Forming,” it must assume the gargantuan task of establishing the voltage and frequency for the entire site.

    Oversimplification in this domain often ignores the “Transient Stability” window. When a large motor starts up, it draws a massive “Inrush Current” that can momentarily sag the voltage of a small microgrid. If the stabilization system cannot respond within cycles—not seconds—the resulting voltage dip can trigger the protective relays of other equipment, causing a “Cascading Failure” across the facility. Understanding On-Site Microgrid Stabilization requires shifting the focus from “Average Power” to “Peak Instantaneous Demand.”

    From a multi-perspective view, stabilization is a three-layer problem: the “Primary” layer (millisecond-scale local response), the “Secondary” layer (second-to-minute scale balance of generation and load), and the “Tertiary” layer (long-term economic and state-of-charge optimization). A failure in any layer eventually migrates to the others. The risk of treating this as a simple “battery problem” is that it ignores the role of “Synchronous Condensers” or “Load Shedding” protocols which are often more cost-effective than simply oversizing a battery array to handle rare peak surges.

    Deep Contextual Background: The Erosion of Grid Inertia

    On-site microgrid stabilization the historical stability of the American electrical grid was a byproduct of “Mechanical Inertia.” Large coal, gas, and nuclear plants used massive spinning rotors that, due to the laws of physics, resisted changes in frequency. If a small factory started a large motor, the rotational energy of turbines hundreds of miles away would provide the “Instantaneous Reserve” to keep the frequency stable. This was a “Passive” stabilization system inherent to the technology of the 20th century.

    As we decouple from fossil fuels, we are replacing these spinning masses with “Inverter-Based Resources” (IBRs). Solar panels and batteries produce Direct Current (DC), which is converted to Alternating Current (AC) via power electronics. These systems have zero physical inertia. Consequently, when a microgrid is islanded, the “Rate of Change of Frequency” (RoCoF) can be incredibly high. A minor imbalance that would be a non-event on the main grid becomes an existential threat to an on-site system. This systemic shift has necessitated the development of “Virtual Inertia”—using software to mimic the behavior of a spinning turbine by forcing inverters to respond rapidly to frequency deviations.

    Conceptual Frameworks and Mental Models On-Site Microgrid Stabilization

    The “Balancing Bucket” Analogy

    Imagine the microgrid as a bucket of water where the water level represents the frequency. Inflows (Generation) must exactly match outflows (Load). In a small bucket (Microgrid), a small splash causes a massive wave, whereas in a lake (Main Grid), the same splash is invisible. Stabilization is the art of using a “Fast-Acting Valve” (BESS) to counteract these splashes before the water spills over.

    The “N-1” Contingency Model

    This framework posits that a microgrid is only stable if it can survive the sudden loss of its largest single generation source or the sudden application of its largest single load without collapsing. This forces planners to design “Operating Reserves”—excess capacity that is kept spinning or “hot” specifically for stabilization rather than for serving the primary load.

    The “Three-Pillar” Stability Matrix

    This model separates stabilization into three distinct technical disciplines:

    1. Voltage Stability: Maintaining the electrical pressure.

    2. Frequency Stability: Maintaining the 60Hz timing of the AC wave.

    3. Rotor Angle/Phase Stability: Ensuring all generation sources are perfectly “In-Sync.”

    Key Categories of Stabilization Architectures

    Architecture Type Stabilization Mechanism Primary Trade-off Application
    Grid-Forming BESS Software-defined Virtual Inertia High inverter cost; complex logic Mission-critical datacenters
    Synchronous Condenser Physical spinning mass (no fuel) Mechanical wear and maintenance Heavy industrial/Motor-heavy sites
    Active Load Management High-speed automated load shedding Requires “Interruptible” processes Facilities with non-critical loads
    Hybrid Kinetic-Chemical Flywheels + Lithium-ion High footprint; highest speed High-tech manufacturing labs

    Realistic Decision Logic

    The choice of architecture is governed by the “Tolerance for Deviation.” A commercial office building can tolerate a 5% voltage sag for 100 milliseconds; a semiconductor fabrication plant cannot. Therefore, the “Precision Demand” of the site’s equipment dictates whether a project invests in expensive Flywheel/UPS combinations or relies on slower, software-based BESS management.

    Detailed Real-World Scenarios On-Site Microgrid Stabilization

    The “Cloud-Transient” Surge

    • The Constraint: A 5MW solar-heavy microgrid operating in islanded mode on a partly cloudy day.

    • The Event: A cloud bank moves over the array, dropping generation by 80% in 10 seconds.

    • The Decision Point: The Microgrid Controller must decide whether to dump the battery or shed “Tier 3” loads (e.g., HVAC) immediately.

    • Failure Mode: If the BESS “Ramp Rate” is too slow, the frequency drops below 58Hz, triggering the main breakers and blacking out the site.

    • Resolution: Implementing “Solar Forecasting” data into the controller to pre-position the BESS charge level before the cloud arrives.

     The “Motor Inrush” Sag

    • The Constraint: An on-site microgrid supporting a food processing plant.

    • The Event: A 500HP compressor kicks on.

    • Second-Order Effect: The voltage sags, causing the contactors on the conveyor belts to chatter and fail.

    • The Fix: Integrating “Variable Frequency Drives” (VFDs) on all large motors to “Soft Start” them, reducing the instantaneous demand and lessening the burden on the stabilization system.

    Planning, Cost, and Resource Dynamics

    Stabilization is an “Insurance Expense”—you are paying for the capability to handle the “1% Event.”

    Component Cost (USD) Variability Factor
    Microgrid Controller (Master) $50,000 – $250,000 Number of integrated I/O points
    Grid-Forming Inverter Premium 20% – 35% extra “Black Start” and Virtual Inertia specs
    Synchronous Condenser $200k – $1M+ Scaled by MVAR (Reactive Power) needs
    Fiber-Optic Relay Network $10 – $25 per ft Speed of “Peer-to-Peer” communication

    Tools, Strategies, and Support Systems On-Site Microgrid Stabilization

    1. Hardware-in-the-Loop (HIL) Simulation: Testing the control logic against a digital twin of the microgrid before deployment.

    2. Phasor Measurement Units (PMUs): High-speed sensors that measure the “State” of the grid 60 times per second to detect oscillations early.

    3. Adaptive Protection Relays: Relays that change their trip settings depending on whether the system is “Grid-Tied” (high fault current) or “Islanded” (low fault current).

    4. Static VAR Compensators (SVC): Used to provide near-instantaneous reactive power for voltage support.

    5. Direct Load Control (DLC): Bypassing local thermostats to shed load directly from the master controller during a stability event.

    6. Hydrogen Peaking Plants: For ultra-long-term stabilization where batteries would be too expensive for multi-day outages.

    7. Machine Learning Dispatch: Predicting load patterns to keep “Spinning Reserves” at the absolute minimum necessary level, saving fuel and wear.

    Risk Landscape and Failure Modes

    • The “Inverter Fight”: If two grid-forming inverters are not perfectly synchronized, they will “fight” each other, creating massive circulating currents that can destroy the power electronics.

    • Communication Latency: If the fiber-optic link between the BESS and the main breaker is delayed by even 50ms, the stabilization command might arrive after the system has already tripped.

    • Cyber-Physical Injection: An attacker compromising the controller could intentionally oscillate the frequency, using the microgrid’s own assets to tear it apart physically.

    Governance, Maintenance, and Long-Term Adaptation On-Site Microgrid Stabilization

    A microgrid is not a “Set-and-Forget” asset. It requires “Tuning” as the site changes.

    The “Stabilization Health” Checklist:

    • Relay Coordination Study: Annual review to ensure that the “Fastest” relay is the one closest to the fault.

    • Battery Internal Resistance Test: Monitoring for aging cells that can no longer provide the high “C-Rate” (burst power) needed for stabilization.

    • Firmware Audit: Ensuring all inverters have the latest “Fault Ride-Through” patches.

    • Island-Transition Drill: A quarterly “Live-Pull” of the main breaker to verify the system can transition without a flicker.

    Measurement, Tracking, and Evaluation

    • Leading Indicators: “Spinning Reserve Margin” (How much excess power is ready right now?); “Phase Angle Deviation” (How far are we from a sync error?).

    • Lagging Indicators: “Voltage Excursion Frequency” (How many times did we leave the +/- 5% band?); “Unscheduled Islanding Success Rate.”

    • Documentation Examples:

      1. The “Event Sequence Recorder” (SER): A millisecond-accurate log of every switch that moved during a fault.

      2. The “Power Quality Audit”: A monthly report on Total Harmonic Distortion (THD).

    Common Misconceptions and Oversimplifications On-Site Microgrid Stabilization

    • Myth: “If I have solar and a battery, I have a microgrid.” Correction: Without a high-speed controller and grid-forming inverters, you merely have a “Backup System” that will fail during the transition.

    • Myth: “Batteries are too slow for stabilization.” Correction: Modern Lithium-ion inverters can respond in sub-cycle speeds (less than 16ms), far faster than any mechanical turbine.

    • Myth: “A microgrid makes me 100% immune to outages.” Correction: Internal faults (a squirrel hitting a transformer on your site) can still take you down; stabilization only protects against systemic imbalance.

    • Myth: “I should island my microgrid all the time to be safe.” Correction: Staying tied to the grid is actually more stable; islanding should be a last resort due to the loss of utility inertia.

    Conclusion

    The engineering of On-Site Microgrid Stabilization represents the final frontier of the energy transition. As we move away from the massive, centralized turbines of the past, we are placing the burden of stability onto localized, software-defined systems. This shift demands a new level of “Electrical Intelligence”—a realization that the quality of power is just as critical as the quantity. By mastering the millisecond-scale dynamics of frequency and voltage, facilities can move beyond the role of “Consumers” and become truly resilient, self-governing nodes in a more flexible, decentralized global grid.

  • The Regulatory Labyrinth: A Systemic Inquiry into Entitlement Security

    The Regulatory Labyrinth: A Systemic Inquiry into Entitlement Security

    How to avoid permit risk in the theater of capital improvement and infrastructure development, the permit is often viewed as a mere administrative hurdle—a bureaucratic “check-the-box” exercise to be completed before the real work begins. This perspective is a fundamental miscalculation of project risk. In reality, the permitting process is a complex, multi-jurisdictional negotiation that sits at the intersection of public safety, environmental law, and municipal politics. To navigate this landscape without a rigorous strategy is to invite catastrophic delays that can erode profit margins, trigger legal disputes, and, in extreme cases, render a project fundamentally non-viable.

    The concept of “Permit Risk” encompasses the probability that a project will be denied necessary authorizations, face significant unexpected conditions for approval, or suffer from debilitating chronological lag in the review cycle. This risk is not a static variable; it is a dynamic pressure that scales with the complexity of the project and the sensitivity of the site.

    This requires a transition from a reactive “apply and wait” posture to a proactive “Compliance Engineering” model. By identifying the “Critical Path” of entitlements early and engaging with regulatory stakeholders as technical partners rather than adversaries, an organization can effectively insulate its capital from the volatility of municipal bureaucracy. This article provides a comprehensive interrogation of the mechanics of entitlement, moving beyond basic checklists to examine the structural strategies required for long-term project resilience.

    Understanding “how to avoid permit risk”

    The endeavor of how to avoid permit risk is frequently misunderstood as a pursuit of “Faster Approvals.” While speed is a desirable byproduct, the primary goal of risk avoidance is “Predictability.”

    Oversimplification in this domain often leads to the “Single-Jurisdiction Fallacy.” Many developers focus exclusively on the primary building permit issued by a city, ignoring the “Sub-Entitlements” required by regional water boards, departments of transportation, or historical commissions. Each of these agencies operates on its own timeline and with its own—often conflicting—criteria. To truly master how to avoid permit risk, one must map the “Interdependency Matrix” of these approvals. A failure to secure a secondary drainage permit can halt the primary building permit, creating a “Deadlock Scenario” that freezes capital and labor.

    Furthermore, there is a risk in treating code compliance as a binary “Yes/No” state. In high-stakes development, the “Discretionary Power” of plan examiners and local boards introduces a level of subjectivity. Understanding the intent behind the code, rather than just the literal text, allows for a more effective negotiation.

    Deep Contextual Background: The Evolution of Regulatory Oversight

    How to avoid permit risk the modern permitting system in the United States is a far cry from the rudimentary zoning and safety checks of the early 20th century. However, the mid-20th century saw the introduction of broader “Social and Environmental Controls.” The National Environmental Policy Act (NEPA) and various state-level equivalents transformed the permit from a structural certification into an environmental and social impact assessment.

    We have now entered the era of “Holistic Entitlement. This expansion of scope has increased the “Surface Area” of permit risk. A project is no longer judged solely on whether the walls will stand, but on its impact on the local watershed, the carbon footprint of its materials, and its effect on neighborhood gentrification.

    This evolution has also changed the “Timeline of Certainty.”This systemic shift has made “Regulatory Fortification”—ensuring the administrative record is ironclad—a central pillar of the development process.

    Conceptual Frameworks and Mental Models How To Avoid Permit Risk

    The “Critical Path of Entitlement” (CPE)

    This framework involves identifying the specific approval that has the longest lead time and the most dependencies. By prioritizing the “Long-Pole” permits (often environmental or zoning variances) rather than the “Easy” permits, the developer ensures that the project schedule isn’t bottlenecked at the 11th hour.

    The “Regulatory Convergence” Model

    Most permits are not isolated; they converge on specific technical requirements. For example, a building’s footprint affects storm-water runoff, which affects environmental permits, which affects site-plan approval. This mental model encourages “Cross-Disciplinary Engineering,” where the architect, civil engineer, and permit expeditor work in a single feedback loop to ensure a change in one area doesn’t trigger a “Cascading Denial” in another.

    The “Stakeholder Influence Map”

    Permit risk is not just technical; it is political. This model categorizes stakeholders into “Decision Makers” (Plan Examiners), “Influencers” (Neighborhood Associations), and “Veto Actors” (Environmental Agencies). Mapping these groups allows the developer to customize their communication strategy, addressing the specific concerns of each group before those concerns become formal objections.

    Key Categories of Permit Hazards

    Navigating the landscape of how to avoid permit risk requires a triage of the various “Friction Points” in the regulatory process.

    Hazard Category Primary Trigger Mitigation Strategy Risk Magnitude
    Zoning Incompatibility Use-case doesn’t match local land use Seek variance or “Special Use” permit High (Potential Project Killer)
    Environmental Discovery Wetlands, endangered species, or toxins Phase 1 & 2 Environmental Site Assessments High (Major Schedule Delay)
    Infrastructure Capacity Overburdened sewer, power, or traffic “Off-site Improvement” proffer Moderate (Unplanned Cost)
    Code Interpretation Subjective examiner judgment Pre-submittal meetings & code analysis Low (Minor Technical Revision)
    Public Opposition Neighborhood noise or traffic concerns Community outreach and “Visual Impact” studies Variable (Political Risk)

    Realistic Decision Logic

    When a conflict arises between a project’s design and a permit requirement, the decision logic must be: “Is the delay cost of a variance greater than the redesign cost of compliance?” In 80% of cases, redesigning for strict compliance is more cost-effective than engaging in a multi-year legal battle for a variance, even if the variance would technically allow for a slightly better product.

    Detailed Real-World Scenarios How To Avoid Permit Risk

    The “Zoning Variance” Stall

    • The Constraint: A developer plans an office-to-residential conversion in a district zoned for commercial-only use.

    • The Error: Applying for a full re-zoning without a pre-negotiated “Development Agreement.”

    • The Outcome: Neighborhood activists use the public hearing to block the project, citing “Character of the Neighborhood.” The project sits in limbo for 24 months, accruing $2M in interest.

    • Mitigation: Pursuing a “PUD” (Planned Unit Development) which offers specific community benefits in exchange for flexible zoning, often smoothing the path to approval.

    The “Overlooked Easement”

    • The Constraint: A warehouse expansion is planned over what appears to be empty land.

    • The Discovery: Mid-review, an examiner identifies an unrecorded municipal utility easement running through the center of the proposed foundation.

    • Failure: The permit is denied because the building would block access to a critical water main.

    Planning, Cost, and Resource Dynamics

    The “Soft Costs” of permitting—fees, consultants, and legal—are often underestimated in initial pro-formas.

    Cost Element Estimated Range (USD) Variability Factor
    Expediting Fees $2,000 – $15,000 Complexity and speed of jurisdiction
    Civil/Environmental Studies $5,000 – $50,000+ Site history and sensitive features
    Traffic Impact Analysis $3,500 – $12,000 Projected trip-generation metrics
    Public Relations/Legal $500 – $2,500 per hour Intensity of local opposition

    Tools, Strategies, and Support Systems

    1. Permit Expediters: Local specialists who understand the “Unwritten Rules” of a specific building department.

    2. Code Compliance Software: Automated checks that compare CAD drawings against current IBC (International Building Code) standards.

    3. Title Reports & ALTA Surveys: Essential for identifying easements and encroachments that trigger permit denials.

    4. “Stop-Work” Insurance: Specialized policies that protect against financial loss due to permit revocations or administrative delays.

    5. Community Liaison Officers: Professionals who manage neighborhood expectations to prevent “NIMBY” (Not In My Backyard) opposition.

    6. “Peer Review” Consultants: Third-party engineers who audit a permit package before it is submitted to the city, catching “Low-Hanging” errors.

    Risk Landscape and Failure Modes How To Avoid Permit Risk

    Permit risk is rarely a single event; it is a “Compounding Cascade.”

    • Agency Deadlock: When Agency A (Transportation) requires a wider road, but Agency B (Environmental) forbids any more impervious surface. This creates a “Logical Impossible State” that can only be resolved through high-level political mediation.

    • The “Administrative Error” Revocation: A permit is issued, construction starts, but a procedural error is discovered in how the public notice was posted. The permit is revoked mid-construction, leading to a total loss of the structure if the error cannot be cured.

    Governance, Maintenance, and Long-Term Adaptation

    For long-term projects (5-10 years), the permit strategy must include “Regulatory Monitoring.”

    The “Entitlement Maintenance” Checklist:

    • Expiration Tracking: Monitoring the “Sunset Clause” on every permit. Most permits expire if construction doesn’t start within 6-12 months.

    • Inspection Coordination: Ensuring that “Special Inspections” (e.g., soil compaction or steel welding) are documented exactly as the permit requires. Failure to document an inspection can lead to a “Denial of Certificate of Occupancy” at the very end.

    • Code Update Audits: Reviewing project plans every 6 months against any new “Code Cycles” adopted by the municipality.

    Measurement, Tracking, and Evaluation How To Avoid Permit Risk

    • Leading Indicators: “Days in Review” vs. “Jurisdictional Average”; the ratio of “Comments per Sheet” (more comments = poorly prepared submittal).

    • Lagging Indicators: “Total Change Orders” caused by permit-required design changes; “Interest Expense” incurred during the permitting delay.

    • Documentation Examples:

      1. The “Permit Tracker”: A centralized dashboard showing every active permit, its expiration date, and current status.

      2. The “Correction Response Letter”: A formal document mapping every city comment to a specific change in the drawings, ensuring the examiner doesn’t have to “Hunt” for the fix.

    Common Misconceptions and Oversimplifications

    • Myth: “Getting a permit is the architect’s job.” Correction: The architect manages the drawings, but the “Entitlement Strategy” is a business management function that involves legal, financial, and political coordination.

    • Myth: “You can always get a variance if you have a good reason.” Correction: Variances are legally defined as “Hardships.” Financial inconvenience is almost never a legal “Hardship.”

    • Myth: “The city has to approve it if I follow the code.” Correction: Many approvals (especially in “Historic Districts”) are “Discretionary,” meaning the board can deny the project based on “Aesthetics” or “General Welfare.”

    • Myth: “I can start ‘Early Grading’ without a full permit.” Correction: Starting any work without a specific “Early Start” permit can lead to immediate “Stop-Work Orders” and permanent blacklisting by local examiners.

    Ethical and Practical Considerations How To Avoid Permit Risk

    The pursuit of how to avoid permit risk must be balanced with the “Social License to Operate.” While it may be legally possible to circumvent certain local concerns through a technical loophole, the long-term reputation of a developer is built on “Regulatory Integrity.” A developer who constantly fights the building department or ignores neighborhood feedback will find that their next project faces 10x more scrutiny.

    Conclusion

    The mitigation of permit risk is not an act of bureaucratic evasion, but a commitment to “Technical Rigor” and “Strategic Foresight.” As the regulatory environment becomes more fragmented and specialized, the ability to secure entitlements predictably will become the primary differentiator between successful projects and financial failures. By treating the permit as a “Dynamic Structural Element”—as vital as the concrete and steel—project leaders can navigate the complexities of municipal oversight and deliver assets that are both compliant and highly profitable.

  • The Strategic Blueprint: Navigating the Fiscal Realities of Site Transformation

    The Strategic Blueprint: Navigating the Fiscal Realities of Site Transformation

    How to plan land development on a budget the conversion of raw acreage into a functional, value-generating asset is a process frequently romanticized but rarely analyzed with the necessary financial rigor. In the current economic climate, characterized by tightening credit markets and escalating material costs, land development has shifted from a speculative endeavor into a precision-engineered management task.

    To approach a plot of land with the intent of improvement is to enter into a complex negotiation with local topography, municipal zoning, and ecological constraints. For the private developer or the small-scale investor, the challenge is amplified by a lack of institutional economies of scale. Budgetary constraints are not merely obstacles; they are the primary architects of the project’s scope. Effective land planning requires a shift from a “vision-first” mentality to a “constraint-based” methodology, where the physical characteristics of the site dictate the financial boundaries of the build.

    The nuance of low-cost development lies in “Pre-emptive Problem Solving.” Every hour spent in the conceptual and permitting stage is an investment against the high-interest carry costs of construction delays. Understanding the systemic interactions between civil engineering, environmental regulations, and utility infrastructure is the only way to avoid the “Financial Quicksand” of unforeseen site work. This article provides a comprehensive editorial interrogation of the mechanics of site optimization, moving beyond superficial cost-saving tips to examine the structural strategies required for lean, high-authority land development.

    Understanding “how to plan land development on a budget”

    The pursuit of how to plan land development on a budget is often mischaracterized as a search for “cheap” labor or materials. In the professional editorial sphere, this objective is more accurately defined as “Capital Efficiency Optimization.” A common misunderstanding among novice developers is the belief that the cheapest parcel of land will yield the lowest development cost. In reality, a “bargain” plot often carries hidden liabilities—such as excessive slopes, poor soil bearing capacity, or the absence of utility “stub-outs”—that can quadruple the site-prep budget.

    Oversimplification risks are prevalent in “DIY” development circles, where there is a tendency to overlook the “Soft Costs” of permitting and environmental impact studies. To truly master how to plan land development on a budget, one must adopt a “Subterranean-First” perspective. A budget-conscious plan prioritizes working with the natural topography rather than fighting it through massive “Cut-and-Fill” operations.

    Furthermore, the “Modularization of Progress” is a critical conceptual shift. Instead of viewing a development as a single, massive expenditure, the expert planner views it as a series of “Phased Milestones.” This systemic approach ensures that the developer remains agile, able to pivot or pause without the catastrophic loss of unallocated resources.

    Contextual Evolution: From Unregulated Sprawl to Strategic Infill

    How to plan land development on a budget historically, land development in the United States was a process of expansion. The shift toward “Smart Growth” and density-driven zoning has introduced new layers of regulatory complexity. Environmental protection acts, storm-water management mandates (such as the Clean Water Act), and ADA compliance requirements have made the “budget” developer’s job significantly more difficult. Today, the cost of land is often secondary to the cost of “Entitlement”—the legal right to develop the land for a specific use.

    Conceptual Frameworks and Mental Models How To Plan Land Development On A Budget

    The “Topographical Lean” Framework

    This model posits that the most expensive action a developer can take is moving dirt. The “Lean” approach mandates that the building footprint and access roads follow the natural contours of the land. This minimizes the need for retaining walls and complex drainage systems, which are among the highest per-linear-foot costs in site development.

    The “Utility Gravity” Model

    Infrastructure is governed by the laws of physics. Water and sewage systems are significantly cheaper when they can rely on gravity rather than mechanical lift stations. A budget-conscious plan identifies the “Natural Drainage Outfall” and positions the high-density components of the project in alignment with existing municipal connections.

    The “Entitlement De-risking” Matrix

    This mental model separates the development process into “Paper Value” and “Physical Value.” The most significant value jump in land development occurs when a piece of raw land becomes “Permitted.” A budget plan focuses heavily on increasing paper value through zoning changes and site-plan approvals before a single shovel enters the ground, as this creates a “Collateralizable Asset” that can attract lower-interest financing.

    Key Categories of Land Transformation

    Identifying the specific nature of a site determines the applicable cost-saving levers.

    Site Category Primary Cost Driver Budget Optimization Strategy Trade-off
    Urban Infill Utility Tap Fees / Demolition Leverage existing “Stub-outs” Limited design flexibility
    Rural Greenfield Access Roads / Well & Septic Cluster development to reduce piping High environmental scrutiny
    Sloped Terrain Retaining Walls / Erosion “Stilt” foundations or stepped slabs Increased structural engineering cost
    Reclaimed/Industrial Remediation / Soil Quality “Capping” vs. Total Removal Long-term liability monitoring

    Realistic Decision Logic

    When evaluating how to plan land development on a budget, the decision logic should be: Does this expenditure increase the “Yield per Acre” or merely the “Aesthetics per Acre”? On a restricted budget, yield (the number of buildable units or functional square footage) must always take precedence. If a luxury entrance adds 5% to the cost but 0% to the density, it is discarded in the planning phase.

    Detailed Real-World Scenarios How To Plan Land Development On A Budget

    The “Utility Extension” Trap

    • The Decision Point: Should the developer pay for the extension or use an on-site septic system?

    • Analysis: Extending municipal lines often triggers “Downstream Capacity Upgrades” that the developer must fund.

    • Resolution: If local codes allow, a “Clustered Septic” system may be 60% cheaper, though it limits total density. The budget plan selects the system that avoids “Off-site Infrastructure” costs.

    The “Over-Engineered” Roadway

    • The Constraint: Local ordinances require a 24-foot wide paved road for a small 4-unit subdivision.

    • The Second-Order Effect: Pavement increases “Impervious Surface” ratios, requiring a massive, expensive storm-water retention pond.

    • Action: Negotiate a “Lesser Standard” or use permeable pavers. Reducing the road width by just 4 feet can reduce the storm-water management budget by 20%.

    Planning, Cost, and Resource Dynamics

    The “Shadow Costs” of land development—taxes, insurance, and interest—are the “Silent Killers” of a budget.

    Phase of Development Direct Cost (Range) Variable Factors
    Feasibility/Survey $5,000 – $15,000 Boundary complexity; tree surveys
    Engineering/Site Plan $10,000 – $40,000 Grading requirements; storm-water calcs
    Permitting/Fees $2,000 – $25,000 Municipal “Impact Fees”
    Site Prep (Mobilization) $5,000 – $20,000 Equipment transport; clearing and grubbing

    Tools, Strategies, and Support Systems How To Plan Land Development On A Budget

    1. GIS (Geographic Information Systems): Using free municipal GIS layers to identify flood zones, wetlands, and soil types before paying for a professional survey.

    2. Shared Infrastructure Agreements: Partnering with adjacent landowners to share the cost of a main road or utility trunk line.

    3. Low-Impact Development (LID) Techniques: Using natural bioswales and rain gardens instead of concrete pipes to manage run-off.

    4. Phased Clearing: Clearing only the “Building Envelope” to preserve existing vegetation, which reduces both clearing costs and future landscaping expenses.

    5. In-Situ Material Reuse: Crushing on-site rock for road base rather than hauling it away and buying new gravel.

    6. Owner-Representative Management: Acting as the “Primary Coordinator” to eliminate the 10-15% “General Conditions” fee charged by large development firms.

    Risk Landscape and Failure Modes

    The primary risk in low-budget development is “The Permit Stall.” Carrying a loan on land for 18 months while waiting for a zoning variance can consume the entire profit margin.

    • Taxonomy of Failure:

      • Regulatory: Discovering an endangered species or archeological artifact mid-clearing.

      • Geotechnical: Hitting “Blue Rock” or an underground spring that wasn’t caught in the initial boring.

    Governance, Maintenance, and Long-Term Adaptation How To Plan Land Development On A Budget

    A budget development plan must include a “Stewardship Protocol” to ensure the site doesn’t degrade during the construction hiatus.

    The “Site Preservation” Checklist:

    • Erosion Control: Silt fences and hydro-seeding must be maintained monthly to avoid municipal fines.

    • Security: Fencing and “No Trespassing” signage to prevent illegal dumping, which can lead to expensive remediation costs.

    • Tax Management: Applying for “Agricultural Exemption” or “Timber Stand” status during the planning phase to reduce holding costs.

    Measurement, Tracking, and Evaluation

    • Leading Indicators: The ratio of “Planned vs. Actual” permitting days; the number of “Cycles of Revision” required by the planning commission.

    • Lagging Indicators: Total “Cost per Buildable Square Foot”; the “Residual Land Value” after entitlements are secured.

    • Documentation Examples:

      1. The “Site Log”: A daily record of weather and site conditions to justify “Rain Day” extensions with contractors.

      2. The “Yield Analysis”: A spreadsheet comparing the ROI of different density configurations.

    Common Misconceptions and Oversimplifications How To Plan Land Development On A Budget

    • Myth: “You can save money by skipping the soil test.” Correction: A $3,000 soil test can save $50,000 in foundation redesigns.

    • Myth: “Buying land in a remote area is always cheaper.” Correction: The cost of bringing power and internet miles into the woods often exceeds the “savings” on the land price.

    • Myth: “I can do my own clearing with a rented skid-steer.” Correction: Professional operators with heavy machinery can clear in 2 days what a novice takes 2 weeks to do, often with less damage to the “Topsoil Integrity.”

    • Myth: “Zoning is fixed.” Correction: Zoning is a “Negotiable Framework.” Proposing a “Planned Unit Development” (PUD) can allow for smaller lots and higher yields if the developer provides a community benefit like a public trail.

    Conclusion

    The successful execution of how to plan land development on a budget is an exercise in “Strategic Restraint.” It requires the developer to resist the urge for immediate physical progress in favor of meticulous, often tedious, analytical preparation. By prioritizing the natural mechanics of the site—gravity, topography, and soil—and navigating the regulatory landscape with surgical precision, one can transform raw land into a high-value asset without the burden of excessive capital expenditure. The “Budget” is not a limitation; it is a discipline that forces a higher level of engineering and management excellence.

  • The Structural Anchor: Navigating the Complexities of Substrata Stabilization

    The Structural Anchor: Navigating the Complexities of Substrata Stabilization

    Common foundation repair mistakes the integrity of a building is fundamentally a negotiation with the soil beneath it. While architectural aesthetics capture the public imagination, the structural viability of any significant asset rests upon a hidden, subterranean system that must reconcile the rigid requirements of masonry with the fluid, shifting dynamics of geology. In the United States, where diverse soil profiles range from the expansive clays of the Sunbelt to the frost-susceptible silts of the North, foundation management is less a matter of “fixing” and more an exercise in forensic engineering and environmental adaptation.

    To address the failure of a foundation is to engage with a high-stakes, low-visibility problem where the margin for error is razor-thin. Unlike a roof leak or a localized plumbing failure, a compromised foundation threatens the “Geometrical Sanity” of the entire structure. A differential settlement of just one inch can initiate a cascading failure of the building’s envelope, compromising window seals, distorting door frames, and fracturing the rigid bonds of the interior finishes. Consequently, the remediation of these issues requires a sophisticated understanding of “Hydraulic Loading” and “Soil-Structure Interaction.”

    In the current market, the pressure to find rapid, cost-effective solutions has led to an uptick in reactive repairs that fail to address the root systemic causes. Many property owners and managers view foundation work through the lens of a “commodity purchase,” assuming that all piers, piles, and stabilization methods are interchangeable. This perspective is fundamentally flawed. A successful intervention requires a diagnostic rigor that accounts for the historical drainage patterns of the site, the chemistry of the local water table, and the long-term seismic or climatic projections for the region. This article provides a definitive, editorial interrogation of the pitfalls inherent in this sector, moving beyond superficial remedies to examine the systemic realities of structural stabilization.

    Understanding “common foundation repair mistakes”

    To categorize common foundation repair mistakes effectively, one must distinguish between “Application Errors” and “Diagnostic Failures.” An application error occurs when a technician installs a high-quality pier incorrectly—perhaps failing to reach the necessary torque or load-bearing strata. However, the more catastrophic and expensive errors are diagnostic. This involves a fundamental misunderstanding of why the foundation is moving. For example, installing rigid piers under a home that is experiencing “Heave” (soil expansion) rather than “Settlement” (soil contraction) can actually exacerbate the structural damage by creating localized pressure points that snap the footings.

    Oversimplification risks are particularly high in the sales-driven side of the industry. Many companies specialize in a single “productized” solution—such as pressed concrete pilings or helical anchors—and attempt to apply that solution to every scenario they encounter. From a professional editorial perspective, this is a “Hammer-and-Nail” fallacy. A homeowner who assumes a “Lifetime Warranty” on a specific pier type is a substitute for a comprehensive drainage plan is making one of the most common foundation repair mistakes. A warranty on a pier does not protect the house if the pier was the wrong choice for that specific soil chemistry.

    Furthermore, the “Localized Focus” error is rampant. Owners often focus exclusively on the corner of the house where the crack is visible, ignoring the fact that the entire foundation acts as a single, monolithic unit. Lifting one corner without accounting for the “Torsional Stress” placed on the rest of the slab can result in new, more severe fractures in areas that were previously stable.

    Contextual Evolution: From Stone Footings to Engineered Piers

    Common foundation repair mistakes the history of foundation construction in the U.S. has moved from “Gravity-Based” systems to “Deep-Foundation” engineering. Early American structures utilized stacked stone or brick footings that relied on massive weight and broad footprints to distribute loads. These systems were surprisingly resilient because they were “Flexible”—they could accommodate minor shifts in the earth without catastrophic cracking. However, they were limited to the shallow, stable soils of specific regions.

    As construction moved into more “Marginal” lands—floodplains, expansive clay zones, and reclaimed wetlands—the industry pivoted toward reinforced concrete slabs and deep-driven pilings. The mid-century boom introduced the “Slab-on-Grade” as a cost-effective standard, but it also created a new class of vulnerability. These rigid slabs are highly sensitive to “Differential Settlement,” where one part of the soil dries out faster than the other.

    Today, we are in the era of “Precision Stabilization.” Modern repairs utilize hydraulic synchronized lifting systems and high-capacity steel piers that can be driven hundreds of feet to hit bedrock or “Competent Strata.” Yet, despite these technological leaps, the human element—the diagnostic judgment of the engineer—remains the most critical variable. The evolution of the field has taught us that we cannot “Out-Engineer” the soil; we must instead design systems that can exist in a state of “Dynamic Equilibrium” with the changing moisture levels of the earth.

    Conceptual Frameworks and Mental Models Common Foundation Repair Mistakes

    The “Active Zone” Framework

    This model posits that soil only moves significantly within a certain depth (the “Active Zone”), which is influenced by seasonal evaporation and rain. Most foundation failures occur because the original footings were placed within this zone. A successful repair must bypass the Active Zone entirely, anchoring the structure in stable, moisture-independent depths.

    The “Hydraulic Path” Mental Model

    In this framework, the foundation is viewed as an obstacle in the natural flow of water. Most foundation issues are actually “Water Management” issues. This model forces the owner to ask: “Where is the water going when it hits the ground?” If the repair doesn’t solve the hydraulic path (e.g., through French drains or swales), the soil will continue to shift, rendering any mechanical lift temporary.

    The “Slab as a Beam” Logic

    This model treats a concrete slab not as a flat surface, but as a structural beam. When the soil beneath a section of the slab erodes or shrinks, that section becomes “Unsupported,” and the slab must act as a beam to span the gap. If the span is too long, the beam (slab) fails. Understanding this helps avoid the mistake of “Under-Piering,” where piers are placed too far apart, causing the slab to sag or “festoon” between the supports.

    Typologies of Foundation Failure and Repair Choices

    Understanding the trade-offs between different repair methods is essential for avoiding long-term asset depreciation.

    Method Best Use Case Primary Trade-off Failure Mode
    Pressed Concrete Pilings Stable, non-expansive soils High friction; may not reach depth “Shingling” (piles tilting out of alignment)
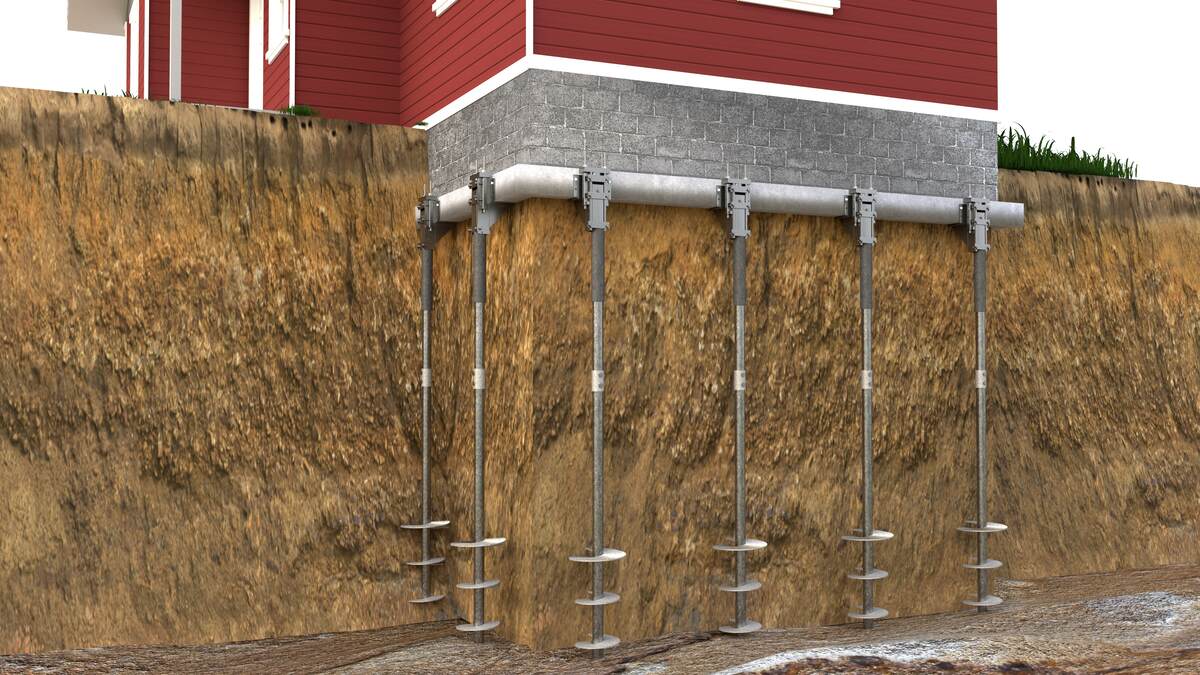
    Steel Helical Piers Light structures / Tension loads Lower weight capacity than push piers “Screw-off” in rocky soils
    Hydraulic Push Piers Heavy residential / Commercial High cost; requires heavy structure Foundation “punch-through” if slab is weak
    Polyurethane Injection Leveling sunken slabs / Void filling Does not provide structural support Over-lifting; blocking underground utilities

    Realistic Decision Logic

    The choice of repair must be dictated by a “Soil Boring Report.” Without knowing exactly what is 30 feet below the surface, any repair choice is a gamble. If the report shows “Fat Clays,” the logic dictates a steel pier that can bypass the clay. If the report shows stable sand but a localized void from a pipe leak, polyurethane injection may be the most efficient, non-invasive path.

    Detailed Real-World Scenarios Common Foundation Repair Mistakes

    The “Dry-Weather” Fix

    • The Constraint: A homeowner notices cracks during a severe drought and hires a company to lift the house.

    • The Error: Lifting the house when the soil is at its most “Shrunken” state.

    • The Outcome: When the rains return, the expansive clay swells, pushing the newly lifted foundation even higher (“Heave”), resulting in catastrophic interior damage and doors that will no longer close.

    • The Lesson: Professional stabilization should ideally occur when soil moisture is at a “Median” level, or must be calculated based on the soil’s potential for expansion.

    The “Partial Piering” Cascade

    • The Constraint: A budget-conscious owner only piers the back wall of a house where the most visible sinking occurred.

    • The Second-Order Effect: The back wall is now “Fixed” to the bedrock, while the front of the house remains “Floating” on the active soil.

    • Failure: As the front of the house continues to settle naturally, the house begins to “Pivot” on the new back piers, creating a massive structural tear through the center of the building.

    Planning, Cost, and Resource Dynamics

    The “Total Cost of Repair” includes not just the piers, but the “Restoration of Integrity” (plumbing, drywall, landscaping).

    Expense Category Typical Range (USD) Variability Factors
    Engineering Report $500 – $2,500 Independent PE vs. “In-house” tech
    Pier Installation $800 – $2,500 (per pier) Depth, accessibility, and material
    Plumbing Testing $300 – $1,500 Static leak tests post-lift
    Landscape/Hardscape Repair $1,000 – $10,000+ Driveway demolition and plant replacement

    Tools, Strategies, and Support Systems

    1. Independent Structural Engineers: The most critical “tool” is an engineer who does not sell repair services, providing an unbiased scope of work.

    2. Manometers (Zip Levels): Precision altimeters used to map the floor’s topography to within 1/10th of an inch.

    3. Root Barriers: Physical or chemical shields installed to prevent large trees from “sucking” the moisture out from under the foundation (Transpiration).

    4. Slab Brackets: Heavy-duty steel plates that transfer the building’s weight from the concrete to the pier without “Spalling” the slab edge.

    5. Ground Penetrating Radar (GPR): Used to locate voids or buried utilities before drilling or driving piles.

    6. Torque Monitoring Systems: Digital readouts that ensure a helical pier has reached the “Competent Soil” specified in the engineering plan.

    Risk Landscape and Failure Modes Common Foundation Repair Mistakes

    The primary risk in foundation work is “Compounding Errors.” A plumbing leak leads to soil erosion; the erosion leads to foundation settlement; the settlement snaps the sewer line; the leaking sewer line further saturates the soil, accelerating the settlement.

    • Taxonomy of Failure:

      • Operational: Pier depth not reached due to “False Refusal” (hitting a rock instead of bedrock).

      • Fiduciary: Mechanic’s liens from sub-contractors if the primary repair company is financially unstable.

      • Systemic: Fixing the “Settlement” but ignoring the “Source” (e.g., a city water main leak or poor neighborhood drainage).

    Governance, Maintenance, and Long-Term Adaptation

    Foundation health is a “Lifecycle Management” task. Once a repair is completed, the site must be “Governed” to prevent a recurrence.

    The “Foundational Integrity” Checklist:

    • Gutters and Downspouts: Ensure they discharge at least 5–10 feet away from the foundation. This is the #1 defense against common foundation repair mistakes.

    • Soaker Hoses: In expansive clay regions, maintaining a consistent (not saturated) moisture level around the perimeter during droughts to prevent the soil from pulling away from the slab.

    • Grade Assessment: Annually check that the soil slopes away from the house (at least 6 inches of drop over 10 feet).

    • Crack Monitoring: Utilizing “Crack Tell-Tale” gauges to determine if a fracture is “Active” (moving) or “Dormant.”

    Measurement, Tracking, and Evaluation Common Foundation Repair Mistakes

    • Leading Indicators: Changes in the “Closing Effort” of interior doors; new “Stair-step” cracks in exterior brickwork; separation of the chimney from the main structure.

    • Lagging Indicators: The “Floor Levelness Survey” results over a 5-year period; the frequency of “Plumbing Blockages” (often caused by pipe shearing).

    • Documentation Examples:

      • Pre-Lift/Post-Lift Elevation Maps: A clear record of exactly how much the house was moved.

      • Pier Depth Logs: A certified record of how deep each pier was driven, essential for future resale and warranty claims.

    Common Misconceptions and Oversimplifications

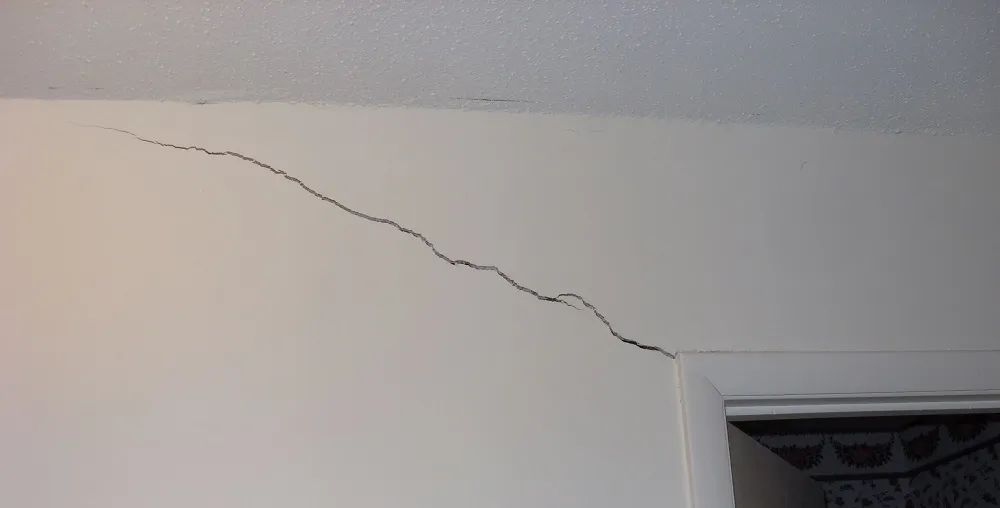
    • Myth: “Cracks in the drywall always mean foundation failure.” Correction: Most homes experience “Seasonal Cycling” or “Thermal Expansion” that causes minor cosmetic cracking. A professional assessment distinguishes these from structural failures.

    • Myth: “You should always lift the house back to perfectly level.” Correction: In older homes, the structure has “Settled” into its shape. Lifting it back to level can shatter the plumbing and the roof. Often, “Stabilization” (stopping the movement) is safer than “Correction” (reversing the movement).

    • Myth: “The pier with the highest weight capacity is the best.” Correction: If the concrete footing is weak, a high-capacity pier will simply “Punch through” the slab like a nail through cardboard. The system is only as strong as its weakest link.

    • Myth: “Tree roots push the foundation up.” Correction: It is usually the opposite. Roots remove the water, causing the soil to shrink and the foundation to sink.

    Conclusion Common Foundation Repair Mistakes

    Addressing the stability of a structure requires a transition from a “Fix-It” mentality to an “Investigative” one. By prioritizing independent engineering, comprehensive water management, and deep-strata anchoring, property owners can protect their most significant assets from the relentless dynamics of the earth. A foundation repair is not merely a construction project; it is a permanent alteration of the building’s relationship with its environment—one that demands technical precision, intellectual honesty, and long-term stewardship.

  • The Equilibrium of Human Capital: A Systemic Inquiry into Workforce Optimization

    The Equilibrium of Human Capital: A Systemic Inquiry into Workforce Optimization

    How to reduce labor cost in the contemporary economic landscape, labor remains the most volatile and significant expenditure on the corporate balance sheet. However, the traditional approach to cost containment—often a reactive, broad-based reduction in headcount—is increasingly viewed as a failure of strategic foresight. Modern organizational leadership has shifted toward a “Total Workforce Optimization” philosophy, recognizing that labor is not a static expense but a dynamic lever that dictates operational throughput and market agility. Reducing costs without compromising the integrity of the “Human Engine” requires a sophisticated understanding of unit labor costs, productivity variance, and the hidden frictions of administrative overhead.

    The complexity of managing labor expenditure has been amplified by the “Skills Gap” and the “Great Renegotiation,” where the power dynamic between employer and employee has reached a delicate stasis. Organizations are no longer operating in a surplus-labor environment. Consequently, the mandate for cost reduction must be balanced against the high cost of attrition and the long-term erosion of institutional knowledge. A shallow focus on hourly wages often ignores the more significant “Total Cost of Employment” (TCE), which includes the amortization of training, the burden of benefits, and the opportunity cost of low engagement.

    To navigate this terrain, one must move beyond the accounting ledger and into the realm of “Industrial Engineering” and “Organizational Psychology.” True efficiency is found at the intersection of process automation and human-centric design. It involves deconstructing every task into its constituent parts to identify “Value-Added” versus “Non-Value-Added” time. This article provides a rigorous, multi-dimensional interrogation of the mechanics of labor expenditure, offering a roadmap for sustainable optimization that prioritizes structural health over short-term financial optics.

    Understanding “how to reduce labor cost”

    The pursuit of how to reduce labor cost is frequently misinterpreted as a mandate for austerity. In a professional, editorial context, this objective is better defined as the “Optimization of Labor Yield.” A common misunderstanding among mid-level management is that reducing the headcount by 10% will result in a 10% reduction in costs. In reality, the “Second-Order Effects”—overtime for the remaining staff, a drop in quality control, and increased recruitment costs due to brand damage—often negate the initial savings.

    Oversimplification risks are particularly high when applying universal benchmarks to specific industries. What constitutes an efficient labor-to-revenue ratio in retail (where labor is a variable cost tied to foot traffic) is catastrophic in high-tech manufacturing (where labor is a fixed investment in specialized skills). To master how to reduce labor cost, an analyst must interrogate the “Friction points” within a workflow. Is the cost high because of the wage rate, or because the workforce is spending 40% of their time navigating fragmented software systems and manual data entry?

    Genuine mastery involves looking at “Labor Density.” This is the measure of how much high-value output is generated per hour of human intervention. By shifting the focus from “Cost per Hour” to “Cost per Unit of Outcome,” a business can identify where it is “Over-Laboring” a process. This might mean that a high-wage expert is actually cheaper than three low-wage novices if the expert produces zero defects and requires no supervision. This multi-perspective approach ensures that cost-cutting does not become “Self-Sabotage.”

    Deep Contextual Background: The Evolution of Labor Metrics

    How to reduce labor cost the history of labor management can be viewed as a transition from “Brawn” to “Brain” and eventually to “Binary.” In the early Industrial Revolution, labor was treated as a fungible commodity. The “Taylorism” of the early 20th century introduced scientific management, focusing on the “One Best Way” to perform physical tasks, effectively treating the human worker as a predictable mechanical component.

    In the post-war era, the rise of the “Knowledge Worker” shifted the metric toward “Output-based” management. However, this period also saw the ballooning of administrative “middle” layers—what some economists call “Bureaucratic Creep.” As organizations grew, the ratio of “Direct Labor” (those making the product) to “Indirect Labor” (those managing the paperwork) became skewed.

    We are currently in the era of “Algorithmic Efficiency.” The modern challenge is not just physical speed, but “Cognitive Load Management.” Labor costs today are driven by the complexity of the global supply chain and the necessity of constant upskilling. Reducing these costs in 2026 requires a “Levers and Pulley” approach: using technology to automate repetitive cognitive tasks so that the human workforce can focus on high-variance problem-solving. This evolution has made labor cost management a function of “Systems Design” rather than simple payroll negotiation.

    Conceptual Frameworks and Mental Models How To Reduce Labor Cost

    The “Waste Hierarchy” (DOWNTIME)

    Derived from Lean manufacturing, this model identifies eight types of waste that inflate labor costs: Defects, Overproduction, Waiting, Non-utilized talent, Transportation, Inventory, Motion, and Extra-processing. By applying this to office environments, managers find that the “Waiting” and “Extra-processing” (redundant meetings/emails) are the primary drivers of labor bloat.

    The “Unit Labor Cost” (ULC) Framework

    This mental model links wages to productivity. If wages rise by 5% but productivity rises by 10%, the “Unit Labor Cost” has actually decreased. This allows for a “High-Wage, Low-Cost” strategy that attracts top talent while maintaining a competitive edge.

    The “Core-Perimeter” Model

    This framework categorizes the workforce into “Core” (permanent, strategic talent) and “Perimeter” (contractors, automated systems, seasonal labor). Reducing costs involves keeping the Core small and highly efficient while using the Perimeter to absorb market volatility, ensuring the organization doesn’t over-hire during peak cycles.

    Key Categories of Optimization How To Reduce Labor Cost

    Optimization strategies are not monolithic; they require a triage based on the specific “Failure Mode” of the organization’s current labor model.

    Strategy Typology Primary Mechanism Trade-off Ideal Application
    Workflow Compression Eliminating redundant approvals Risk of reduced oversight High-growth tech, Creative agencies
    Skill-Task Alignment Moving low-skill tasks to lower-cost tiers Potential for “Siloing” expertise Legal, Medical, Financial Services
    Automation Substitution Replacing manual data entry with RPA High initial CapEx Logistics, Payroll, Manufacturing
    Flexible Scheduling Aligning labor hours to demand curves Lower employee predictability Hospitality, Retail, Healthcare

    Realistic Decision Logic

    When an organization asks how to reduce labor cost, the first decision is whether the problem is “Capacity” or “Efficiency.” If capacity is the issue (too many people for the work), the solution is structural. If efficiency is the issue (the right number of people doing the work poorly), the solution is process-oriented. Mixing these two—for instance, firing people to solve a process problem—results in a “Spiral of Incompetence.”

    Detailed Real-World Scenarios How To Reduce Labor Cost

    The “Meeting-Heavy” Engineering Team

    • The Constraint: A team of 50 software engineers spending 15 hours a week in non-technical meetings.

    • The Calculation: At an average burdened rate of $150/hr, the organization is “spending” $112,500 per week on talk.

    • The Intervention: Implementing “Async-First” communication and limiting meetings to 30 minutes with strict agendas.

    • Second-Order Effect: Reclaiming 10 hours per engineer per week is equivalent to “hiring” 12 new engineers for free.

    The “Over-Specified” Administrative Layer

    • The Constraint: A healthcare provider using Registered Nurses (RNs) to perform basic data entry and patient intake.

    • The Decision Point: Utilizing Medical Assistants (MAs) or automated kiosks for intake.

    • Analysis: By shifting 40% of the RN’s shift to MAs, the cost per patient visit drops significantly while RN job satisfaction (and retention) increases.

    Planning, Cost, and Resource Dynamics

    The “Cost of Optimization” often acts as a barrier to entry. Many firms continue with inefficient labor models because they lack the “Transition Capital” to change.

    Phase of Optimization Direct Cost Indirect Cost Opportunity Risk
    Diagnostic Audit $20k – $100k Management time Identifying the wrong “Lever”
    Software Implementation $50k – $500k Employee “Learning Curve” Integration failure with legacy systems
    Structural Realignment Severance/Hiring fees Loss of morale / Attrition “Brain Drain” of key experts

    Tools, Strategies, and Support Systems

    1. Robotic Process Automation (RPA): Tools that act as “Digital Labor,” handling repetitive keystrokes in accounting or HR.

    2. Cross-Training Matrices: Ensuring that “Person A” can do “Job B” during peak periods, reducing the need for temporary external labor.

    3. Variable Compensation Structures: Tying a portion of pay to “Productivity Milestones” rather than just hours clocked.

    4. Workforce Management (WFM) Software: Using AI to predict demand spikes and optimize shift patterns (essential in the “best smart cities united states” infrastructures).

    5. BPO (Business Process Outsourcing): Moving non-core functions (like Tier 1 customer support) to lower-cost geographical regions.

    6. “Self-Service” Architectures: Enabling customers or employees to handle their own data entry (e.g., automated portals).

    Risk Landscape and Failure Modes How To Reduce Labor Cost

    The most dangerous failure mode in labor cost reduction is “The Productivity Paradox.” This occurs when the tools or processes meant to save time actually create new, more complex work.

    • The “Shadow Work” Trap: When an admin is laid off, their work doesn’t disappear; it is distributed to higher-paid executives who are now spending $300/hr doing $25/hr work.

    • The Quality Death Spiral: Reducing labor in quality assurance leads to product returns, which require more customer service labor, creating a net loss.

    • Regulatory Friction: In states with rigid labor laws, shifting schedules too aggressively can lead to “Predictive Scheduling” penalties or class-action litigation regarding overtime misclassification.

    Governance, Maintenance, and Long-Term Adaptation

    A labor reduction strategy is not a “Set-and-Forget” exercise. It requires a “Governance Loop” to ensure that the organization doesn’t “Re-Bloat.”

    The “Efficiency Review” Checklist:

    • Monthly: Review the “Labor as % of Revenue” trend line.

    • Quarterly: Audit “Span of Control” (the number of direct reports per manager). If a manager has only 2-3 reports, the layer is likely redundant.

    • Annually: Perform a “Task-to-Value” mapping to ensure that new technologies haven’t rendered current roles obsolete.

    • Trigger Event: Any time a department requests a “New Headcount,” they must first demonstrate that they have optimized their current “Wait Time” and “Redundancy” metrics.

    Measurement, Tracking, and Evaluation How To Reduce Labor Cost

    • Leading Indicators: “Employee Utilization Rate” (the percentage of hours spent on billable/productive work); “Average Time to Completion” for standard tasks.

    • Lagging Indicators: “EBITDA per Employee”; “Voluntary Turnover Rate”; “Total Labor Burden per Unit of Output.”

    • Documentation Examples:

      1. The “Labor Dashboard”: A live view of labor spend vs. budget by department.

      2. Productivity Heatmaps: Identifying specific shifts or teams that are consistently “Under-Yielding.”

    Common Misconceptions and Oversimplifications

    • Myth: “Low wages always equal low labor cost.” Correction: High-wage labor is often more “Cost-Effective” due to lower error rates and higher self-management capabilities.

    • Myth: “Remote work reduces labor costs.” Correction: It reduces real estate costs, but can increase labor costs through “Communication Drag” if not managed with rigorous async protocols.

    • Myth: “Overtime is always bad.” Correction: Occasional overtime is often cheaper than hiring a new full-time employee with a full benefits package.

    • Myth: “AI will replace all labor.” Correction: AI is a “Force Multiplier” that replaces tasks, not roles. The goal is “Augmentation,” not total replacement.

    Ethical and Practical Considerations How To Reduce Labor Cost

    The “Invisible Cost” of labor optimization is the social contract. An organization that optimizes its labor costs by creating a “High-Stress, Low-Security” environment will eventually pay a “Loyalty Tax.” This manifests as high recruitment costs and a lack of innovation. Sustainable labor reduction must be “Transparent.” Employees who understand that efficiency gains protect the firm’s long-term viability—and perhaps lead to “Profit Sharing”—are more likely to participate in the process rather than resist it.

    Conclusion

    Mastering how to reduce labor cost is an ongoing negotiation between “Mechanical Efficiency” and “Human Potential.” The most successful organizations do not view their workforce as a cost to be minimized, but as a system to be refined. By applying rigorous conceptual frameworks, investing in high-yield tools, and maintaining a vigilant governance structure, a business can achieve a lean, agile posture that is resilient to economic volatility. The ultimate objective is a workforce that is not just “Cheaper,” but significantly more “Impactful.”

  • The Friction of Execution: Navigating the Complexities of Construction Management

    The Friction of Execution: Navigating the Complexities of Construction Management

    How to manage contractor problems the delivery of a complex construction project is rarely a linear progression from architectural intent to physical reality. It is, instead, a high-stakes exercise in risk management and human psychology. In a professional landscape characterized by labor shortages, volatile material costs, and increasingly intricate building codes, the relationship between a client and a general contractor often operates under significant structural tension. This tension is not inherently negative; when channeled correctly, it ensures accountability and precision. However, when left unmanaged, it manifests as delays, budgetary creep, and litigation.

    The modern construction environment has evolved far beyond the “handshake agreement” era. Today, the execution of a project involves a sophisticated web of sub-contractors, specialized engineers, and supply chain logistics. Consequently, a problem on-site is rarely the result of a single person’s incompetence. It is usually the failure of a system—a breakdown in communication protocols, an oversight in the procurement schedule, or a misunderstanding of the “Scope of Work” (SOW). To view contractor issues as mere personality conflicts is a fundamental error that leads to reactive, rather than proactive, management.

    True expertise in this field lies in the ability to identify “early-warning signals” before a project reaches a state of crisis. This requires an analytical mindset that prioritizes documentation over emotion and contractual clarity over verbal assurances. It involves understanding the industrial pressures that contractors face—such as the “Trade Sequencing” crunch or the “Lien” laws that govern their financial safety. By adopting a systemic perspective, a project owner transforms from a frustrated observer into a strategic manager of resources.

    Understanding “how to manage contractor problems”

    To master how to manage contractor problems, one must first decouple the “symptom” from the “systemic cause.” A symptom might be a crew not showing up on a Tuesday morning; the systemic cause, however, is often a cash-flow delay from a previous project or a failure in the contractor’s labor-scheduling software. Many project owners attempt to solve these issues through escalation—anger or threats—which frequently results in a “work-to-rule” mentality where the contractor does the bare minimum to avoid legal breach but ceases to offer the proactive problem-solving essential for high-end builds.

    Common misunderstandings center on the belief that a strong contract is a substitute for active management. While a contract provides the legal floor, it does not provide the operational ceiling. Oversimplification risks occur when owners assume that withholding payment is the primary lever for control. In reality, withholding payment is often a “nuclear option” that can trigger a mechanics’ lien or cause the contractor to prioritize other, paying clients, thereby exacerbating the delay.

    A professional approach to this challenge involves “Symmetrical Information.” This means ensuring that both the owner and the contractor have the same understanding of the “Critical Path”—the sequence of stages that determines the project’s completion date. When you understand the logic behind the construction sequence, you can ask targeted questions that force the contractor to confront logistical gaps without resorting to confrontation. This intellectual shift from “policing” to “steering” is the hallmark of effective project governance.

    Contextual Evolution: The Shifting Balance of Power

    How to manage contractor problems the methodology of construction oversight has undergone a radical transformation. In the mid-20th century, the “Design-Bid-Build” model was the absolute standard. Owners held significant leverage because trades were plentiful and material costs were predictable. Problems were managed through a rigid hierarchy.

    However, the 21st century has introduced “Hyper-Complexity.” Modern homes and buildings now integrate smart-home automation, advanced HVAC systems, and sustainable materials that require specialized certification. This has shifted the balance of power toward the contractor, who acts as the gatekeeper to specialized labor. Furthermore, the “Gig Economy” has infiltrated the trades; a general contractor may no longer have a permanent crew, instead relying on a rotating cast of 1099 freelancers. This “Fragmentation of Responsibility” is the root of most modern project friction, making the management of problems a task of “Integrative Oversight” rather than traditional command-and-control.

    Conceptual Frameworks and Mental Models How To Manage Contractor Problems

    The “Incentive Alignment” Framework

    This model posits that most contractor problems arise because the owner’s goal (maximum quality at fixed cost) and the contractor’s goal (maximum margin through speed) are naturally at odds. Management, therefore, is the process of creating “Intermediate Milestones” that reward the contractor for quality and transparency, rather than just the final handover.

    The “Complexity-Certainty” Matrix

    This framework helps owners categorize problems based on their nature. A “Simple” problem (wrong paint color) requires immediate correction. A “Complex” problem (foundation drainage issues) requires a pause and a third-party engineering review. The failure to distinguish between these leads to “Patchwork Solutions” that fail later in the asset’s lifecycle.

    The “Critical Path” Transparency Model

    Project management should never be a “Black Box.” This model dictates that the contractor must provide a “Look-Ahead” schedule every two weeks. This forces the contractor to plan for the “Next Step” resources (e.g., ordering tiles six weeks before they are needed), which prevents the “Dead-Week” syndrome where no one is on-site because materials haven’t arrived.

    Key Categories of Contractor Issues

    Navigating the execution phase requires a taxonomy of potential failures. Understanding the trade-offs in how these are handled is vital.

    Issue Category Primary Driver Trade-off of Aggressive Action Resolution Strategy
    Communication Decay Over-reliance on verbal cues Can lead to “Ghosting” if handled poorly Mandate Weekly Written Status Reports
    Quality Divergence Speed-over-standard mindset Rework costs vs. project delays “Hold-Point” Inspections before closing walls
    Financial Instability “Robbing Peter to pay Paul” Risk of abandonment vs. Lien risk Direct-to-Sub payments or Joint Checks
    Scope Creep Unclear initial specifications Higher costs vs. functional regret Formal Change Order (CO) Protocol

    Realistic Decision Logic

    When a problem occurs, the logic should be: Is this a Breach of Contract or a Breakdown of Process? If it is a process breakdown, the solution is a “Corrective Action Plan” (CAP). If it is a breach, the solution involves formal “Notice to Cure.” Jumping to a Notice to Cure for a process breakdown often kills the working relationship prematurely.

    Detailed Real-World Scenarios How To Manage Contractor Problems

    The “Ghosting” Sub-Contractor

    • The Constraint: The General Contractor (GC) claims the plumber isn’t answering calls, stalling the entire bathroom build-out.

    • The Decision Point: Should the owner contact the plumber directly?

    • Analysis: No. Contacting subs directly undermines the GC’s authority and can create legal confusion over who is “Directing the Work.”

    • Resolution: Request the GC’s “Sub-Contractor Agreement.” If the GC doesn’t have a backup plumber or a liquidated damages clause for their subs, the problem is a “Management Deficit” on the part of the GC, not just a “Missing Plumber.”

    The “Hidden Defect”

    • The Constraint: After drywall is installed, a leak is detected, but the source is behind the finish.

    • The Second-Order Effect: Opening the wall delays the painter and the cabinet installer.

    • Action: Conduct a “Forensic Deconstruction.” If the error was the contractor’s, they absorb the cost of repair and the “re-drywalling.” If it was a design flaw, the owner pays. Establishing this “Fault-Logic” early prevents weeks of finger-pointing.

    Planning, Cost, and Resource Dynamics

    The “Cost of Friction” is often higher than the cost of the repair itself. Delays have a compounding effect on financing (interest carry) and opportunity costs (delayed move-in or rental income).

    Expense Type Range (as % of Budget) Impact of Mismanagement
    Contingency Fund 10% – 20% Exhausted early due to “unforeseen” errors
    Supervision Costs 3% – 5% Hidden costs if the owner must “babysit” the GC
    Rework/Correction 2% – 8% Direct loss of material and labor hours
    Legal/Consultation 1% – 5% High variability based on escalation speed

    Tools, Strategies, and Support Systems How To Manage Contractor Problems

    1. Project Management Software (Procore/CoConstruct): Centralizing all photos, daily logs, and change orders in one cloud-based source of truth.

    2. Lien Waivers: Never issue a progress payment without a signed lien waiver from both the GC and all major sub-contractors for the previous phase.

    3. Third-Party Owner’s Rep: In ultra-long or luxury builds, hiring a professional advocate to manage the contractor’s schedule daily.

    4. Schedule of Values (SOV): A detailed breakdown of every dollar in the contract, tied to specific physical progress, preventing “Front-Loading” where the contractor gets 80% of the money for 50% of the work.

    5. Punch-List Management: Using a “Rolling Punch-List” rather than waiting for the end of the project to find defects.

    6. Video Documentation: Recording “behind-the-wall” plumbing and electrical before insulation to ensure future problems can be diagnosed without demolition.

    Risk Landscape and Failure Modes

    The most dangerous failure mode is “The Sunk Cost Trap.” This occurs when an owner continues to pay a failing contractor because they have already spent $100,000 and fear that firing them will cause a total loss.

    • Compounding Risks: A delay in the roof leads to moisture in the framing, which leads to mold, which leads to an air-quality failure three months after the project “finishes.”

    • Taxonomy of Failure:

      • Operational: Schedule slippage.

      • Fiduciary: Misuse of funds/Liens.

      • Structural: Non-compliance with building codes.

    Governance, Maintenance, and Long-Term Adaptation How To Manage Contractor Problems

    Governance is the “Rhythm” of the project. If the rhythm is broken, problems multiply.

    The “Integrity Checklist”:

    • Weekly Site Meetings: Mandatory, with minutes recorded and distributed within 24 hours.

    • The “Clean-Site” Rule: A messy site is a leading indicator of sloppy work. Enforcing site cleanliness is a tool for managing mental discipline.

    • Adjustment Triggers: If a milestone is missed by more than 7 days, a “Recovery Schedule” must be submitted by the contractor before the next payment is released.

    Measurement, Tracking, and Evaluation

    • Leading Indicators: The ratio of “Open Issues” to “Resolved Issues” in the weekly log; the frequency of the GC’s presence on-site.

    • Lagging Indicators: Total Change Order percentage at the end of the project; “Days Beyond Original Completion.”

    • Documentation Examples:

      • The Daily Log: A simple record of weather, headcount, and work performed.

      • The Variance Report: Comparing the actual cost of a phase to the budgeted cost in real-time.

    Common Misconceptions and Oversimplifications How To Manage Contractor Problems

    • Myth: “I’ll just hire my own subs to save money.” Correction: Unless you are a licensed professional, you cannot manage the “Sequencing” or “Liability” of multiple trades. You become the GC, and you inherit all the problems.

    • Myth: “The architect will manage the contractor.” Correction: Unless you pay for “Construction Administration” (CA), the architect’s job ends at the drawing board.

    • Myth: “A fixed-price contract protects me from all cost increases.” Correction: “Unforeseen Conditions” and “Owner Changes” can still trigger massive costs even in fixed-price models.

    • Myth: “Contractors always try to cheat.” Correction: Most problems are the result of poor estimation and “Optimism Bias”—contractors genuinely believe they can finish faster than they can.

    Conclusion

    Mastering how to manage contractor problems is ultimately an exercise in “Professional Detachment.” It requires the owner to step back from the emotional weight of their project and view the construction site as a production environment that requires constant calibration. The goal is not to eliminate all problems—which is an impossibility in a field as volatile as construction—but to build a framework where problems are identified early, documented clearly, and resolved through a pre-negotiated logic. A project that finishes with a few managed hurdles is far more successful than one that finishes “perfectly” but leaves the participants in a state of financial and emotional exhaustion.

  • The Architecture of Resilience: Navigating Global Value Chain Volatility

    The Architecture of Resilience: Navigating Global Value Chain Volatility

    How to manage supply chain problems the contemporary global supply chain is no longer a linear sequence of events but a high-dimensional web of interdependencies. For decades, the primary objective of logistics was the relentless pursuit of efficiency—minimizing inventory, maximizing throughput, and driving down unit costs through offshore labor and “just-in-time” delivery models. However, the systemic shocks of the mid-2020s have exposed the profound fragility inherent in these optimized systems. Efficiency, it appears, often functions as a tax on resilience; the thinner the margin for error, the more catastrophic the impact of a single failure point.

    Managing these complexities requires a departure from reactive logistics toward a discipline of strategic supply chain governance. It is not enough to simply “solve” a bottleneck as it appears; organizations must now engineer their value chains to absorb shocks, pivot in real-time, and maintain continuity amidst geopolitical shifts, climate-driven disruptions, and radical fluctuations in consumer demand. This shift demands a sophisticated analytical framework that views supply chain health as a core determinant of organizational solvency rather than a back-office utility.

    The challenge lies in the “Information Gap”—the persistent lack of visibility beyond tier-one suppliers. When a fundamental component fails to arrive, the root cause is frequently buried three or four layers deep in a sub-tier network that the end producer barely understands, let alone controls. To bridge this gap, leaders are moving toward “Digital Thread” integration and predictive modeling. This editorial serves as a definitive interrogation of the mechanics of modern supply disruption and provides a rigorous roadmap for those tasked with ensuring that goods flow in an increasingly unpredictable world.

    Understanding “how to manage supply chain problems”

    The methodology of how to manage supply chain problems is frequently misunderstood as an exercise in “firefighting”—responding to delayed shipments or port congestion with frantic re-routing. While immediate tactical responses are necessary, they are often symptomatic. A multi-perspective analysis suggests that most supply chain failures are “design-side” errors. If a product is engineered with a “single-source” critical component that can only be manufactured in one specific geographic region, the problem is not the shipping delay; the problem is the inherent fragility of the product’s bill of materials.

    One of the most pervasive misunderstandings in the industry is the conflation of “Lean” with “Fragile.” Lean methodology aims to eliminate waste, but in many organizations, this has been misinterpreted as the total elimination of “Safety Stock.” When disruptions occur, these organizations have zero temporal buffer, forcing them into expensive air-freight solutions or production stoppages. The oversimplification risk here is treating the supply chain as a static cost to be reduced, rather than a dynamic asset to be managed.

    Furthermore, we must address the “Bullwhip Effect”—a phenomenon where small fluctuations in consumer demand at the retail level create massive, oscillating swings in production requirements at the manufacturing level. Strategizing how to manage supply chain problems requires an admission that data latency is the enemy. If it takes three weeks for a drop in sales to be communicated to a raw material supplier, the resulting overproduction creates a localized depression in the market. True management involves “Demand Sensing”—using real-time data to dampen these oscillations before they destabilize the entire network.

    Contextual Background: From Silk Roads to Synchronized Logistics

    How to manage supply chain problems the evolution of the supply chain is a story of increasing speed and decreasing visibility. Historically, trade routes like the Silk Road were resilient because they were decentralized; if one caravan was lost, others would take different paths. The Industrial Revolution introduced the “Linear Chain,” where the focus shifted to mass production and the centralized control of inputs.

    The 1970s and 80s brought the “Globalized Model,” driven by the containerization of shipping and the rise of East Asian manufacturing. This era prioritized “Unit Cost” above all else. By the 2010s, we reached the “Hyper-Synchronized” era, where components traveled across borders six times before final assembly. However, the 2020s marked the “Great Re-evaluation.” We are now entering an era of “Multi-Localism” or “Friend-Shoring,” where the goal is to shorten the physical distance between production and consumption while diversifying geographic risk.

    Conceptual Frameworks and Mental Models How To Manage Supply Chain Problems

    The “OODA Loop” for Supply Chains

    Observe, Orient, Decide, Act. In a supply chain context, this means having the sensors in place to Observe a port strike, the context to Orient how it affects your specific inventory, the authority to Decide on a pivot, and the logistics contracts to Act immediately.

    The “Antifragile” Supply Chain

    Based on Nassim Taleb’s concept, an antifragile supply chain is one that doesn’t just survive volatility but thrives on it. This is achieved through “Optionality”—maintaining redundant suppliers and flexible manufacturing lines that can be reconfigured to produce different products as market needs shift.

    The “Inventory-as-Insurance” Model

    Rather than viewing inventory solely as a liability on the balance sheet, this model treats a portion of stock as a “Prepaid Insurance Premium.” The cost of holding that stock is the “Premium” paid to ensure the “Payout” of continued operations during a market shortage.

    Key Categories of Supply Chain Friction

    Category Primary Driver Trade-off
    Sourcing Risk Single-source dependency Low cost vs. High vulnerability
    Logistics Risk Port congestion, fuel spikes Speed vs. Predictability
    Demand Risk Inaccurate forecasting Stock-outs vs. Excess inventory
    Geopolitical Risk Tariffs, trade wars Market access vs. Regulatory stability
    Technical Risk Data breaches, system downtime Automation vs. Manual resilience
    Environmental Risk Climate events, resource scarcity Sustainability vs. Resource security

    Realistic Decision Logic

    When a disruption occurs, the logic should follow a “Constraint-Impact” hierarchy:

    1. Criticality: Is this a “Line-Stop” item? If yes, cost is secondary to acquisition.

    2. Lead Time: Can we air-freight a small “bridge” quantity while the sea-freight is delayed?

    3. Substitution: Can the engineering team approve an alternative material or component without compromising safety?

    Detailed Real-World Scenarios How To Manage Supply Chain Problems

    The “Tier-Three” Semiconductor Shortage

    • The Constraint: An automotive manufacturer has a robust relationship with its Tier-1 electronics supplier.

    • The Problem: A fire at a specialized resin factory in Japan (Tier-3) halts the production of the plastic casing for a specific sensor.

    • The Result: Car production stops globally because of a $0.05 plastic part.

    • Lesson: Mapping the supply chain to the “Sub-Tier” level is no longer optional; it is a requirement for risk management.

    The “Just-in-Time” Collapse in Healthcare

    • The Constraint: A hospital system relies on daily deliveries of surgical kits to minimize storage space.

    • The Disruption: A major regional blizzard shuts down the local distribution hub for 48 hours.

    • Failure Mode: Elective surgeries are canceled, leading to a massive loss of revenue and patient trust.

    • Logic: Certain sectors (Health, Food, Energy) cannot afford “Lean” logistics; they require “Buffer-Heavy” architectures.

    Planning, Cost, and Resource Dynamics

    The “Total Cost of Fulfillment” is often 20-30% higher than the “Purchase Price” when problems occur.

    Cost Component Nature of Expense Variability
    Holding Costs Warehouse rent, insurance, capital cost 15% – 25% of inventory value
    Expediting Costs Emergency air-freight, courier fees Extreme (up to 10x standard)
    Obsolescence Material that becomes unusable during delay High in tech and fashion
    Administrative Overhead Procurement labor for “Firefighting” Often unmeasured but significant

    The “Cost of Distance” Table

    Tools, Strategies, and Support Systems How To Manage Supply Chain Problems

    1. Supply Chain Control Towers: Centralized data hubs that integrate GPS tracking, weather patterns, and supplier financial health into a single dashboard.

    2. Blockchain for Traceability: Ensuring the “Provenance” of raw materials to avoid legal or ethical supply risks.

    3. AI-Driven Forecasting: Moving beyond simple “Historical Averages” to include social media trends and macroeconomic signals.

    4. Vendor Managed Inventory (VMI): Shifting the responsibility of stock levels to the supplier, ensuring they have “Skin in the Game.”

    5. Multi-Sourcing (The 70/30 Rule): Sourcing 70% from a primary, low-cost supplier and 30% from a secondary, geographically different supplier to keep the “backup” active.

    6. Digital Twins: Simulating the impact of a Suez Canal-style blockage on your specific SKU list before it happens.

    Risk Landscape and Failure Taxonomy

    We must categorize failures by their “Compound Potential.” A “Simple Failure” is a delayed truck. A “Compound Failure” is a delayed truck carrying a component for a product that is already in “Backorder” status during a “Peak Season.”

    • Upstream Failure: Raw material unavailability.

    • Internal Failure: Production bottlenecks or labor strikes.

    • Downstream Failure: Distribution center outages or last-mile failure.

    • Cyber Failure: Ransomware attacks on logistics providers.

    Governance, Maintenance, and Long-Term Adaptation How To Manage Supply Chain Problems

    Supply chain health requires a “Continuous Audit” cycle.

    The Resilient Supply Chain Checklist:

    • Quarterly: Conduct a “Stress Test” of the top 10 most critical SKUs.

    • Bi-Annually: Audit “Tier-2” and “Tier-3” suppliers for financial stability.

    • Annually: Re-calculate “Safety Stock” levels based on the previous year’s volatility index.

    • Ad-Hoc: Review the “Geopolitical Exposure” of any new supplier before onboarding.

    Measurement, Tracking, and Evaluation

    • Leading Indicators: “Supplier On-Time Delivery” (OTD) trends; “Raw Material Price Indices”; “Port Dwell Times.”

    • Lagging Indicators: “Cost per Unit Fulfilled”; “Out-of-Stock Frequency”; “Customer Order Cycle Time.”

    • Documentation Examples:

      1. The Supply Chain Risk Register: A ranked list of threats and their pre-planned “Mitigation Triggers.”

      2. The “Should-Cost” Model: An analysis of what a part should cost, helping procurement identify when a supplier is price-gouging during a crisis.

    Common Misconceptions and Oversimplifications How To Manage Supply Chain Problems

    • Myth: “Technology will solve all supply chain problems.” Correction: Technology only provides visibility; “Relationships” solve problems. A phone call to a long-term supplier often gets results that an automated portal cannot.

    • Myth: “Onshoring is the only way to be safe.” Correction: Domestic supply chains are also vulnerable to local labor strikes, power grid failures, and regional disasters. “Diversity” is safer than “Location.”

    • Myth: “Low inventory is always good management.” Correction: Low inventory is a “Precision Bet” that the world will be stable. If the world is unstable, low inventory is a liability.

    • Myth: “Freight costs are non-negotiable.” Correction: In times of disruption, “Non-Monetary” negotiations (like guaranteed volumes or priority status) are more valuable than a 5% price cut.

    Ethical and Practical Considerations

    There is an increasing “Moral Cost” to the supply chain. Managing problems cannot involve ignoring labor rights or environmental destruction in the pursuit of continuity. “Forced Labor” in a sub-tier supplier is a “Legal and Reputational Risk” as much as a delayed shipment is a “Logistical Risk.” Practically, the move toward “Circular Supply Chains”—where materials are recovered and reused—is the ultimate hedge against resource scarcity and ethical violations.

    Conclusion How To Manage Supply Chain Problems

    Mastering how to manage supply chain problems is fundamentally about the management of uncertainty. It requires a move from the “Certainty of the Spreadsheet” to the “Probability of the World.” The most resilient organizations are those that build “Mechanical Slack” into their systems—not out of laziness, but as a deliberate engineering choice. By embracing geographic diversity, deep-tier visibility, and a culture of rapid adaptation, a supply chain transforms from a fragile link in the chain to a foundational source of competitive strength.

  • The Anatomy of Friction: A Systematic Inquiry into Project Failure

    The Anatomy of Friction: A Systematic Inquiry into Project Failure

    Common project management mistakes the execution of complex initiatives is fundamentally an exercise in managing entropy. In any organizational endeavor, from infrastructure development to digital transformation, the natural tendency of a system is toward disorder, miscommunication, and resource depletion. Project management exists as the countervailing force to this entropy, yet the discipline itself is often practiced through a lens of administrative box-checking rather than strategic foresight. When projects fail, they rarely do so because of a single catastrophic event; they succumb to a cumulative buildup of microscopic misalignments that eventually reach a tipping point.

    A profound tension exists between the theoretical frameworks of project governance and the messy, non-linear reality of human collaboration. While methodologies provide a scaffolding for order, they cannot account for the volatility of stakeholder sentiment, the fragility of supply chains, or the “optimism bias” inherent in initial underwriting. The professional environment is currently defined by a “hyper-velocity” expectation—the demand to deliver more with less, faster than ever before. This pressure creates a fertile ground for institutional errors that are often misdiagnosed as bad luck when they are, in fact, structural deficiencies.

    To engage with the nuances of project delivery is to admit that most failures are preventable. However, prevention requires a departure from the “post-mortem” mindset toward a “pre-mortem” philosophy. It involves identifying the patterns of failure before they manifest. This editorial serves as a rigorous dissection of the psychological, technical, and systemic hurdles that derail modern initiatives. By interrogating these failures with intellectual honesty, organizations can move beyond reactive crisis management and toward a state of resilient, predictable execution.

    Understanding “common project management mistakes”

    The nomenclature of failure in professional settings often obscures more than it reveals. When we discuss common project management mistakes, we are typically referring to the delta between a planned outcome and a realized reality. However, a multi-perspective analysis suggests that these mistakes are rarely the result of a lack of effort. Instead, they are the byproduct of “Mental Model Mismatch”—where the manager uses a linear tool (like a Gantt chart) to solve a non-linear problem (seismic shifts in market demand or team morale).

    One of the most pervasive misunderstandings is the belief that project management is a purely technical discipline. Many organizations over-index on “Hard Skills”—software proficiency, scheduling, and budget tracking—while neglecting the “Political Ecology” of the project. A project can be perfectly on-time and under-budget while still being a failure if it fails to achieve “Organizational Absorption,” meaning the end-users refuse to adopt the new system or product. The oversimplification risk here is treating project management as a “delivery” function rather than a “change management” function.

    Furthermore, we must address the “Precision Fallacy.” It is a common error to confuse a detailed plan with a correct plan. The more granular a 24-month schedule is at the start of a project, the more likely it is to be inaccurate. Strategizing how to navigate common project management mistakes requires an admission of uncertainty. Effective leaders build “Strategic Buffers” not just for time and money, but for “Cognitive Load.” They recognize that a team operating at 100% utilization has zero capacity to handle the inevitable “unknown unknowns” that arise in any complex system.

    Contextual Background: From Scientific Management to Agile Flux

    Common project management mistakes the history of project delivery is a progression from “Predictability” to “Adaptability.” In the early 20th century, Frederick Taylor’s “Scientific Management” treated workers as cogs in a machine, where efficiency was the only metric that mattered. This gave way to the rigid “Waterfall” methodologies used in massive 1950s infrastructure projects—schemes where the requirements were frozen years in advance.

    However, as the global economy shifted toward software and services, the “Cost of Change” plummeted while the “Volatility of Requirements” skyrocketed. This birthed the Agile Manifesto in 2001, which prioritized individuals and interactions over processes and tools. Yet, this shift introduced a new set of errors: “Process-less Agile,” where teams mistake a lack of documentation for flexibility. We are now in a “Hybrid” era, where the primary challenge is integrating the long-term predictability required by the C-suite with the iterative speed required by the technical teams.

    Conceptual Frameworks and Mental Models Common Project Management Mistakes

    To diagnose a project in distress, practitioners apply several diagnostic mental models:

    The “Iron Triangle” and the Quality Void

    The classical model posits that Scope, Time, and Cost are linked; changing one affects the others. The mistake often made is attempting to fix all three, which inevitably forces the “Quality” and “Team Health” into a downward spiral. The triangle is not just a constraint; it is a trade-off machine.

    Parkinson’s Law and the “Work Expansion” Trap

    This framework suggests that “work expands so as to fill the time available for its completion.” When managers provide overly generous buffers for individual tasks without centralizing that buffer at the project level, they inadvertently encourage “Gold-Plating”—adding unnecessary features that complicate the final delivery.

    The “Sunk Cost” Fallacy in Governance

    This is perhaps the most damaging psychological error. Organizations continue to fund failing projects because they have already invested significant resources, failing to realize that the “Forward-Looking” cost of completion may far exceed the value of the project. A high-maturity organization is one that knows how to kill a project gracefully.

    Key Categories of Project Friction

    Project errors typically fall into distinct operational silos, each requiring a specific mitigation strategy.

    Category Primary Error Mode Trade-off
    Scope Governance Scope Creep (uncontrolled growth) Flexibility vs. Finish-ability
    Communication The “Information Silo” Transparency vs. Cognitive Overload
    Resource Allocation “Multi-tasking” Fatigue Throughput vs. Context Switching
    Risk Management Reactive “Firefighting” Upfront Cost vs. Long-term Stability
    Stakeholder Alignment The “Absent Sponsor” Autonomy vs. Executive Support
    Technical Debt Speed over Sustainability Short-term Launch vs. Maintenance Cost

    Realistic Decision Logic

    When a project starts to deviate, the logic must be: “Is this a execution problem or a strategy problem?” If it is execution, add discipline and remove blockers. If it is strategy (the requirements are fundamentally flawed), adding more labor will only accelerate the failure.

    Detailed Real-World Scenarios Common Project Management Mistakes

    The “Kitchen Sink” Product Launch

    • The Problem: A software company attempts to include every requested feature in a Version 1.0 release.

    • The Failure: The launch is delayed by 14 months; by the time it ships, the market has moved on to a simpler competitor.

    • Second-Order Effect: The engineering team burns out, leading to a 30% turnover rate in the following quarter.

    The “Under-Estimated” Integration

    • The Problem: An M&A project assumes that two different IT systems will “talk” to each other with a simple API bridge.

    • The Reality: The data structures are incompatible at a foundational level.

    • Result: A $2 million integration budget balloons to $12 million.

    • Logic: This is a failure of “Pre-Project Discovery”—treating a guess as a fact.

    Planning, Cost, and Resource Dynamics

    The “Cost of Failure” is rarely just the budget overrun. It is the “Opportunity Cost” of what the team could have been doing instead.

    Project Component Direct Cost Variance Indirect Impact
    Initial Planning 5% – 10% Sets the “Trajectory of Success”
    Change Management 10% – 20% Dictates User Adoption rates
    Testing/QA 15% – 25% Prevents “Reputational Damage”
    Buffer/Contingency 10% – 15% Absorbs the “Unknown Unknowns”

    The “Brooks’s Law” Range

    In software and creative projects, adding people to a late project makes it later. The “Communication Overhead” grows at , meaning with every new person, the number of communication channels increases exponentially, further slowing the core work.

    Tools, Strategies, and Support Systems Common Project Management Mistakes

    To mitigate common project management mistakes, leaders utilize a “Tactical Stack”:

    1. Work Breakdown Structure (WBS): Decomposing a gargantuan goal into “Melt-proof” work packages.

    2. Critical Path Method (CPM): Identifying the specific sequence of tasks that cannot be delayed without delaying the whole project.

    3. Monte Carlo Simulations: Using statistical modeling to find the “Probability of Success” rather than a single-date guess.

    4. The “Pre-Mortem” Workshop: Imagining the project has failed and working backward to identify the causes.

    5. Kanban Visuals: Making “Work-in-Progress” visible to prevent over-allocation.

    6. RACI Matrices: Defining exactly who is Responsible, Accountable, Consulted, and Informed to stop “Decision Deadlock.”

    Risk Landscape and Failure Taxonomy

    We must distinguish between “Strategic Risk” (the project is the wrong thing to do) and “Tactical Risk” (doing the right thing poorly). A “Compounding Failure” occurs when a technical delay (Tactical) causes the project to miss a market window, turning it into a Strategic failure.

    • Type 1 Errors: Doing something that should not have been done (Scope bloat).

    • Type 2 Errors: Not doing something that should have been done (Ignoring risk signals).

    Governance, Maintenance, and Long-Term Adaptation Common Project Management Mistakes

    A project is not “done” when it launches; it is done when it is successfully transitioned to “Operations.”

    The “Continuity” Checklist:

    • Phase Gates: Does the project have hard “Stop/Go” points where the business case is re-evaluated?

    • Change Control Board (CCB): Is there a formal process for adding scope, or is it “Handshake” deals?

    • Post-Implementation Review (PIR): Are the lessons learned actually documented, or are they lost as the team disperses?

    Measurement, Tracking, and Evaluation

    • Leading Indicators: Throughput (Velocity); “Red-to-Green” recovery time; stakeholder sentiment scores.

    • Lagging Indicators: Budget Variance (BV); Schedule Performance Index (SPI); Net Promoter Score (NPS) from end-users.

    • Documentation Examples:

      1. The Risk Register: A living document ranking risks by “Impact” and “Probability.”

      2. The Decision Log: Why was a certain path taken? (Prevents “Historical Revisionism”).

      3. The Variance Report: Not just that we are late, but why we are late.

    Common Misconceptions and Oversimplifications Common Project Management Mistakes

    • Myth: “Micromanagement ensures quality.” Correction: Micromanagement creates a “Bottle-neck” and destroys team agency, leading to slower delivery.

    • Myth: “A late project can be fixed with overtime.” Correction: Overtime leads to “Diminishing Returns” and an increase in error rates that takes longer to fix later.

    • Myth: “Technology will solve project management.” Correction: Software is just a mirror. If your process is broken, software just makes it broken faster.

    • Myth: “The PM is the ‘Boss’ of the team.” Correction: The PM is a “Servant Leader” whose job is to remove obstacles so the experts can do the work.

    Conclusion

    The landscape of common project management mistakes is essentially a map of human psychology and organizational friction. By shifting from a culture of “Blame” to a culture of “Inquiry,” organizations can transform their project delivery from a source of stress into a competitive advantage. The goal is “Intellectual Honesty”—the willingness to see a project exactly as it is, rather than how we wish it to be.

  • The Calculus of Custom Construction: Fiscal Discipline in Residential Development

    The Calculus of Custom Construction: Fiscal Discipline in Residential Development

    How to plan home building on a budget the realization of a custom home is frequently characterized as the most significant financial commitment an individual will undertake. Yet, the process is often governed by emotional aspirations rather than a cold-eyed assessment of logistical and economic realities. Planning a home build requires navigating a dense thicket of volatile material markets, labor shortages, and increasingly stringent municipal regulations. To treat the budget as a secondary concern to aesthetics is to invite the “cost-plus” spiral that leaves many projects stalled at the framing stage or finished with compromised interiors.

    True efficiency in residential construction is not found in the selection of cheaper faucets or the use of inferior lumber. Instead, it is an intellectual exercise conducted during the pre-construction phase. It involves a fundamental re-evaluation of the “program”—the essential list of needs versus wants—and an understanding of how architectural geometry dictates structural expense. A building with sixteen corners and a complex roofline will always be fundamentally more expensive to enclose than a simplified volume, regardless of the finishes applied later.

    This editorial serves as a high-level roadmap for the sophisticated owner-builder or developer. We will examine the systemic drivers of cost, from the hidden geology of a lot to the “soft cost” carry of construction financing. By shifting the focus from “cutting costs” to “optimizing value,” one can achieve a structure that is both architecturally significant and fiscally sustainable. The goal is to build with intentionality, ensuring that every dollar invested contributes directly to the long-term equity and functional performance of the asset.

    Understanding “how to plan home building on a budget”

    The primary hurdle in how to plan home building on a budget is the tendency to view the budget as a fixed target rather than a moving target. Many prospective homeowners begin with a “Cost-per-Square-Foot” estimate, which is a dangerously blunt instrument. A 2,000-square-foot box is vastly cheaper than a 2,000-square-foot cantilevered glass modern, yet the “standard” metric fails to account for these structural complexities. Understanding the budget requires a multi-perspective view that accounts for site-specific conditions, the “time-value” of money, and the volatility of the supply chain.

    A common misunderstanding is that “budget building” means sacrificing quality. On the contrary, some of the most budget-conscious homes are the highest performing because they prioritize the “building envelope” over surface-level ornamentation. The risk of oversimplification lies in the “finish-first” mentality. Owners often allocate their budget toward high-end kitchen appliances and Italian marble while neglecting the insulation, HVAC efficiency, and moisture barriers—systems that, if underfunded, will cost exponentially more to repair or operate over the building’s lifecycle.

    Furthermore, the planning process must account for the “Regulatory Tax.” In many jurisdictions, the cost of impact fees, utility hookups, and environmental permits can consume up to 20% of a budget before a single board is nailed. Strategizing how to plan home building on a budget therefore necessitates a “Bottom-Up” forensic audit of the local building department’s requirements. True fiscal control is achieved by identifying these “non-negotiable” costs early, allowing the remaining discretionary funds to be allocated with surgical precision.

    Contextual Background: The Shift from Craft to Commodity

    How to plan home building on a budget historically, home building was a local affair, utilizing materials sourced within a short radius of the site. This naturally dictated the vernacular architecture and kept costs predictable. In the post-war era, the “Industrialization” of housing introduced standardized components—2×4 lumber, plywood, and gypsum board—which lowered the barrier to entry but decoupled the building from its site.

    Today, we are in a “Post-Industrial” phase where global supply chain shocks can double the price of copper or OSB overnight. The modern builder is no longer just a craftsman; they are a logistics manager and a risk assessor. The evolution of “Smart” and “Green” building codes has also added layers of technical complexity that were non-existent thirty years ago. In this environment, the “Budget Home” has evolved from a simple shelter into a high-performance machine that requires sophisticated planning to remain affordable.

    Conceptual Frameworks and Mental Models How To Plan Home Building On A Budget

    The “Envelope-to-Volume” Ratio

    This model suggests that the most cost-effective home is the one with the least amount of exterior wall and roof area for the amount of interior space provided. A two-story cube is the mathematical pinnacle of this ratio. Every bump-out, dormer, or recessed porch increases the “Surface Area,” which in turn increases material costs and energy loss.

    The “80/20” Rule of Finishes

    In residential construction, 20% of the items—cabinets, countertops, flooring—often drive 80% of the perceived “luxury.” This framework encourages builders to use “Builder Grade” materials for hidden or utility areas (laundry rooms, guest closets) while concentrating the budget on the “High-Touch” zones like the kitchen island or the primary entry.

    The “Modular Grid” Thinking

    Most American building materials come in 4-foot or 8-foot increments. Planning a home that aligns with these dimensions reduces “off-cut” waste. If a room is 13 feet wide, you are paying for 16 feet of material and throwing 3 feet in the dumpster. Designing to the grid is a “Silent” way to reduce cost without changing the quality of the materials.

    Key Categories of Residential Cost Optimization

    Category Optimization Strategy Trade-off
    Site Prep Select a “Flat” lot with existing utilities Higher initial land purchase price
    Foundation Slab-on-grade vs. Full Basement Lost storage and mechanical space
    Framing Advanced Framing (O.C. spacing) Requires specialized engineering review
    Roofing Simple Gable vs. Complex Hips/Valleys Conventional aesthetic vs. “Designer” look
    Fenestration Standardized window sizes Less “Custom” architectural rhythm
    HVAC Mini-split/Zoned systems Visible interior wall units

    Realistic Decision Logic

    When determining how to plan home building on a budget, the decision tree should prioritize “Irreversible” systems:

    1. Site & Foundation: You cannot easily change the foundation once the house is up. Invest here first.

    2. Structural Shell: High-performance framing and windows are difficult to upgrade later.

    3. Interior Aesthetics: These are “Wear Items.” Plan to upgrade the laminate counters to quartz in five years when cash flow allows.

    Detailed Real-World Scenarios How To Plan Home Building On A Budget

    The “Unseen” Site Costs

    • The Problem: A buyer purchased a “cheap” hillside lot for $50,000 less than a flat lot.

    • The Reality: The cost of retaining walls, specialized septic, and “Pier-and-Beam” foundations totaled $120,000.

    • Failure Mode: The project ran out of money before the drywall was installed.

    • Lesson: Budgeting begins at the “Feasibility” stage of land acquisition, not the architectural stage.

    The “Wet Wall” Consolidation

    • The Problem: An architect placed the kitchen, the master bath, and the laundry room in three different corners of the house.

    • The Pivot: Re-designing the floor plan to “Stack” or “Cluster” the plumbing along a single central “Wet Wall.”

    • Result: A 30% reduction in plumbing labor and materials, plus faster hot water delivery to all fixtures.

    Planning, Cost, and Resource Dynamics

    The variance in home building costs is largely driven by “indirect” factors that owners often overlook.

    Cost Component Typical % of Budget Volatility Opportunity for Savings
    Soft Costs (Permits/Fees) 10% – 15% Low Identifying “Impact Fee” waivers
    Lumber/Steel/Roofing 20% – 30% High Buying during “Off-Season”
    Labor (Trades) 35% – 45% Moderate Being the “General Contractor”
    Finishes/Fixtures 15% – 25% Low Wholesale/Overstock sourcing

    Tools, Strategies, and Support Systems

    1. Cost-Plus vs. Fixed-Price Contracts: Fixed-price protects the owner from material spikes but often includes a “buffer” that increases the total.

    2. Owner-Builder Loans: Specialized financing that allows you to act as your own GC, potentially saving 15-20% in “Profit and Overhead.”

    3. Sweat Equity: Identifying tasks (landscaping, painting, cleanup) that the owner can perform safely to reduce labor draws.

    4. Re-Store/Salvage Sourcing: Using high-quality reclaimed doors or lighting fixtures to add character for a fraction of the cost of new “antiqued” items.

    5. Energy Modeling: Spending $500 on a HERS rating during design to downsize the HVAC system, saving $2,000 on equipment.

    Risk Landscape and Failure Modes How To Plan Home Building On A Budget

    • The “Scope Creep” Trap: Adding “just one more foot” to a room or upgrading a shower head mid-build. These “Small” changes are the primary cause of budget failure.

    • The “Vague Specification” Risk: If a contract says “Hardwood floors” without specifying the species or grade, the contractor will install the cheapest option, leading to disputes.

    • The “Under-Capitalized” Builder: If your contractor is using your “Draw” to pay off their previous job, your project is at risk of a “Lien” or total stoppage.

    Governance and Long-Term Asset Adaptation

    Planning on a budget requires a “Maintenance-First” mindset. A cheap roof that leaks in ten years is not a budget roof; it is a liability.

    The Budget Alignment Checklist:

    • Design Phase: Does the roof pitch allow for standard asphalt shingles?

    • Bidding Phase: Did I get three “Apples-to-Apples” bids with line-item breakdowns?

    • Build Phase: Am I physically on-site to ensure materials aren’t being wasted or stolen?

    • Post-Occupancy: Have I set aside a “Reserve Fund” for the inevitable settling and minor repairs of a new home?

    Measurement, Tracking, and Evaluation How To Plan Home Building On A Budget

    Track your budget using “Percentage Complete” rather than “Dollars Spent.” If you have spent 50% of your budget but the house is only 30% framed, you have a systemic problem.

    • Leading Indicator: The “Variances” in the first three draws (Foundation, Framing, Rough-ins).

    • Lagging Indicator: The total “Change Order” cost at the end of the project.

    • Documentation: Maintain a “Binder” of all warranties, sub-contractor contacts, and material SKU numbers for future repairs.

    Common Misconceptions and Oversimplifications

    • Myth: “Small houses are always cheaper.” Correction: The “Fixed Costs” (Permits, Kitchen, Bath) are the same; a small house often has a higher per-square-foot cost.

    • Myth: “Architects are too expensive for budget builds.” Correction: A good designer can save you $20,000 in structural efficiency, more than covering their fee.

    • Myth: “Modern style is cheaper because it’s simple.” Correction: Modern style requires “Zero-Tolerance” craftsmanship because there is no trim or molding to hide mistakes.

    Conclusion How To Plan Home Building On A Budget

    The art of how to plan home building on a budget is found in the rejection of “Disposable Architecture.” It is a commitment to the “Long Game”—investing in a tight, efficient shell that protects the inhabitants and the wallet. By utilizing frameworks like the Envelope-to-Volume ratio and maintaining a rigorous governance over “Soft Costs,” the modern builder can transcend the chaos of the market. Building on a budget is not an act of deprivation; it is an act of superior engineering and disciplined imagination.

  • The Architecture of Stability: A Comprehensive Inquiry into Structural Integrity

    The Architecture of Stability: A Comprehensive Inquiry into Structural Integrity

    How to avoid structural risk the built environment is an exercise in managing the relentless forces of physics. Every skyscraper, bridge, and industrial facility exists in a state of precarious equilibrium, balancing gravity, lateral loads, and environmental stressors against the resistance of materials and the precision of engineering. In this context, “risk” is not a singular event but a latent property of the system—a potential energy waiting for a flaw in design, a lapse in maintenance, or an unforeseen external shock to manifest as a failure. To address these vulnerabilities requires more than adherence to local building codes; it demands a deep, systemic understanding of how materials and geometries interact over time.

    Structural integrity is often perceived as a binary state: a building is either standing or it is not. However, experienced engineers and asset managers recognize that stability exists on a spectrum of performance. A structure may be “safe” by legal standards while harboring significant risks that threaten its long-term viability, insurance profile, or operational continuity. The modern challenge lies in navigating an increasingly complex risk landscape—one defined by aging infrastructure, more frequent extreme weather events, and the introduction of novel, high-performance materials that lack the century-long track record of traditional steel and concrete.

    This editorial deconstructs the mechanisms of stability and the strategies required to preserve it. We move beyond the superficial symptoms of distress—such as cracks or settling—to investigate the root causes of instability: the “hidden” failures in waterproofing, the geochemical degradation of foundations, and the compounding effects of deferred maintenance. By integrating predictive modeling with rigorous physical governance, organizations can shift from a reactive “repair” mindset to a proactive “preservation” strategy. The goal is the creation of a resilient built environment that survives not just the expected loads, but the unpredictable stresses of a changing world.

    Understanding “how to avoid structural risk”

    The primary difficulty in how to avoid structural risk is the “Invisibility Factor.” Unlike mechanical systems that signal failure through noise or heat, structural elements often suffer in silence until a critical threshold is crossed. A common misunderstanding among facility owners is the belief that a lack of visible distress equates to a lack of risk. In reality, the most dangerous risks—such as the “carbonation” of concrete or the hydrogen embrittlement of high-tension cables—occur at a molecular level, shielded from the naked eye.

    From a multi-perspective view, avoiding risk involves balancing “Static Capacity” with “Dynamic Resilience.” A bridge may be perfectly capable of carrying its rated dead load, but it may lack the damping capacity to survive a seismic event or high-frequency wind oscillations. The oversimplification risk here is treating structural safety as a one-time achievement of the design phase. True safety is an ongoing process of “Verification and Validation.” It requires a continuous loop of feedback where real-world performance data is used to update the original engineering assumptions.

    Furthermore, we must address the “Interface Risk.” Most structural failures do not occur in the middle of a beam or a slab; they occur at the connections—the joints where steel meets concrete, or where the building’s envelope meets its frame. Strategizing how to avoid structural risk requires a forensic focus on these transition points. If water is allowed to penetrate a joint, it triggers a chain reaction of corrosion that can compromise the entire load-bearing path. Therefore, structural risk management is, in many ways, an exercise in rigorous moisture control and connection integrity.

    Contextual Background: The Evolution of Structural Philosophy

    How to avoid structural risk the history of structural safety is a transition from “Empirical Over-Design” to “Limit State Optimization.” In the 19th century, before the mathematical modeling of stress was fully refined, engineers relied on massive “Factors of Safety.” If a floor needed to hold 100 pounds, it was built to hold 1,000. While this produced durable structures, it was economically and environmentally inefficient.

    The 20th century introduced “Load and Resistance Factor Design” (LRFD), which allowed for lighter, taller, and more expressive architecture by accurately calculating the probability of specific loads. However, this precision reduced the “Buffer” for error. Modern structural philosophy is now moving toward “Performance-Based Design.” Instead of merely following codes, engineers simulate how a building will behave during a 100-year flood or a 7.0 magnitude earthquake. This shift represents a move from compliance to resilience—ensuring that even if a building is damaged, it fails gracefully without a sudden collapse.

    Conceptual Frameworks and Mental Models How To Avoid Structural Risk

    The “Load Path” Mental Model

    Every pound of weight in a building must travel from the roof through the columns and into the soil. This model suggests that you must be able to trace this path without interruption. Any “Breach” in the load path—such as a tenant cutting through a floor joist for a new staircase—introduces immediate, unmanaged risk.

    The “Redundancy vs. Efficiency” Framework

    In engineering, redundancy is the presence of “Back-up” load paths. If one column fails, the surrounding structure “Bridges” the gap. While redundancy increases cost and material usage, it is the primary defense against “Progressive Collapse.” The framework forces a decision: Where is the cost of failure high enough to justify the price of redundancy?

    The “Bathtub Curve” of Reliability

    Structures face the highest risk during two phases: “Infant Mortality” (construction errors or design flaws revealed immediately after completion) and “Wear-out” (end-of-life degradation). The middle period is relatively stable. This model helps managers allocate resources to intense commissioning at the start and forensic inspection at the end of a building’s lifecycle.

    Key Categories of Structural Vulnerability

    Category Primary Risk Driver Critical Indicator Mitigation Strategy
    Geotechnical Soil subsidence, liquefaction Cracks in foundation walls Piling, soil stabilization
    Material Degradation Rebar corrosion, sulfate attack Spalling (flaking) concrete Cathodic protection, sealants
    Environmental Wind uplift, snow loading Excessive deflection (sagging) Dynamic damping, stiffening
    Seismic Lateral shear, resonance Floor-to-wall separation Base isolation, shear walls
    Anthropogenic Unauthorized renovations Bowing of secondary members Strict permit/drawing control
    Hydraulic Hydrostatic pressure, scouring Water ingress in basements French drains, waterproofing

    Detailed Real-World Scenarios How To Avoid Structural Risk

    The “Corrosion of the Hidden Tendon”

    • The Constraint: A post-tensioned parking garage in a coastal environment.

    • The Problem: Micro-cracks in the concrete allow salt-laden air to reach the high-strength steel tendons.

    • The Failure: The tendons corrode and snap internally. Because they are “Hidden” within the concrete, there is no visible sagging.

    • Logic: Avoiding this risk requires “Acoustic Monitoring” to listen for the sound of snapping wires, combined with regular “Half-Cell Potential” testing to measure corrosion levels.

    The “Soft Story” Seismic Collapse

    • The Constraint: A multi-story apartment building with a ground-floor garage (large open spaces, few walls).

    • The Result: During an earthquake, the “Stiff” upper floors stay intact, but the “Soft” ground floor lacks lateral resistance and collapses.

    • Decision Point: Retrofitting with steel “Moment Frames” to add stiffness without losing parking space.

    The “Thermal Bridge” Degradation

    • The Constraint: A modern glass-tower with steel balconies protruding through the building envelope.

    • The Failure: The steel conducts cold into the warm interior, causing condensation inside the wall assembly.

    • Second-Order Effect: The constant moisture rusts the primary structural connections that hold the facade to the frame.

    • Resolution: Installing “Thermal Breaks” to decouple the exterior steel from the interior structure.

    Planning, Cost, and Resource Dynamics

    The financial cost of structural safety is often back-loaded.

    Investment Phase Cost Level Benefit Risk of Neglect
    Design/Peer Review Low Catching “Logic Errors” 100x cost to fix later
    Material Quality Control Moderate Ensuring concrete strength Structural voids/weak points
    Waterproofing/Sealing Moderate Preventing corrosion Life-shortening of asset
    Structural Retrofitting High Extending building life Catastrophic failure

    The “Cost of Deferral” How To Avoid Structural Risk

    If a $10,000 waterproofing repair is deferred for five years, it often compounds into a $250,000 structural concrete restoration project. The “Compound Interest” of structural decay is one of the most significant financial risks in real estate.

    Tools, Strategies, and Support Systems

    1. Ground Penetrating Radar (GPR): Non-destructive testing to locate rebar, voids, and conduits inside solid concrete.

    2. Structural Health Monitoring (SHM): Installing sensors (accelerometers, strain gauges) that provide real-time data on how a structure is breathing and moving.

    3. BIM for Lifecycle Management: Using 3D models to track exactly when and where maintenance was performed on specific beams.

    4. UAV (Drone) Inspections: Accessing high-risk areas (bridge undersides, towers) without the cost and danger of scaffolding or rope access.

    5. Digital Twin Stress Testing: Simulating “What-If” scenarios (e.g., “What if a truck hits this column?”) on a digital model.

    6. Laser Scanning/Lidar: Creating an “As-Built” map to detect if a building has tilted or settled by even a few millimeters.

    Risk Landscape and Compounding Failures How To Avoid Structural Risk

    Structural risk rarely travels alone. It follows a “Taxonomy of Compounding Failures.” For instance, a small roof leak (Environmental) leads to moisture on a steel truss (Material). The truss rusts and loses 20% of its thickness (Capacity). A heavy snowstorm occurs (Load). The weakened truss fails, and because the building lacks Redundancy, the entire roof collapses (Systemic).

    This is the “Domino Effect” of structural neglect. The most critical risk is not the storm; it is the “Pre-existing Condition” that the storm exploits. To effectively execute how to avoid structural risk, one must identify these “Force Multipliers”—the small defects that make a building vulnerable to large events.

    Governance, Maintenance, and Long-Term Adaptation

    Stability requires a “Governance of the Physical.” This involves a clear hierarchy of responsibility for every structural element.

    The Layered Maintenance Checklist:

    • Monthly: Visual walk-through of basements and roofs for water ingress.

    • Annual: Professional “Condition Assessment” focusing on expansion joints and drainage.

    • 5-Year: Deep-dive forensic testing (concrete core samples, steel thickness gauging).

    • Event-Triggered: Immediate inspection following any seismic activity, high-wind event, or impact.

    Measurement, Tracking, and Evaluation How To Avoid Structural Risk

    • Leading Indicators: Crack growth rate (measured in mm/year); chloride ion concentration in concrete.

    • Lagging Indicators: Deflection beyond L/360 limits; visible spalling; insurance premium hikes.

    • Documentation Examples:

      1. The “Structural Logbook”: A historical record of every crack, repair, and inspection.

      2. Deflection Maps: A heat map showing which areas of a floor are sagging over time.

      3. Material Certification Sheets: The “Birth Certificate” of the concrete and steel used in the build.

    Common Misconceptions and Oversimplifications

    • Myth: “Concrete is permanent.” Correction: Concrete is a porous, chemical sponge that eventually “expires” as it reacts with CO2 and water.

    • Myth: “If the building stood for 50 years, it’s fine.” Correction: Fatigue and “Cumulative Damage” mean that the 51st year is often higher risk than the 1st.

    • Myth: “Adding more steel always makes it stronger.” Correction: “Over-reinforcing” concrete can actually make it brittle and prone to sudden, explosive failure rather than visible, ductile bending.

    • Myth: “Paint is just aesthetic.” Correction: High-performance coatings are the primary “Shield” against the corrosion that causes structural collapse.

    Ethical and Practical Considerations How To Avoid Structural Risk

    There is an ethical dimension to “Life-Safety.” Structural engineers and owners hold a “Fiduciary Duty” to the occupants. When budgets are tight, there is a temptation to “Value Engineer” the structural systems. However, while you can save on carpet or lighting without risking lives, saving on the “Skeleton” of the building is a gamble with human safety. Practically, the most resilient organizations are those that treat structural integrity as a “Non-Negotiable Baseline”—an investment that protects the “License to Operate.”

    Conclusion

    To master how to avoid structural risk is to engage in a permanent dialogue with the physical world. It requires a humility that respects the power of the elements and a discipline that refuses to ignore the subtle signals of decay. Buildings are not static objects; they are dynamic systems that age, breathe, and react. By applying rigorous conceptual frameworks—from the Bathtub Curve to the Load Path model—and utilizing the latest diagnostic tools, we can ensure that our built heritage remains a foundation of safety rather than a source of danger. The ultimate measure of a structure is not its height or its beauty, but its enduring, silent reliability.